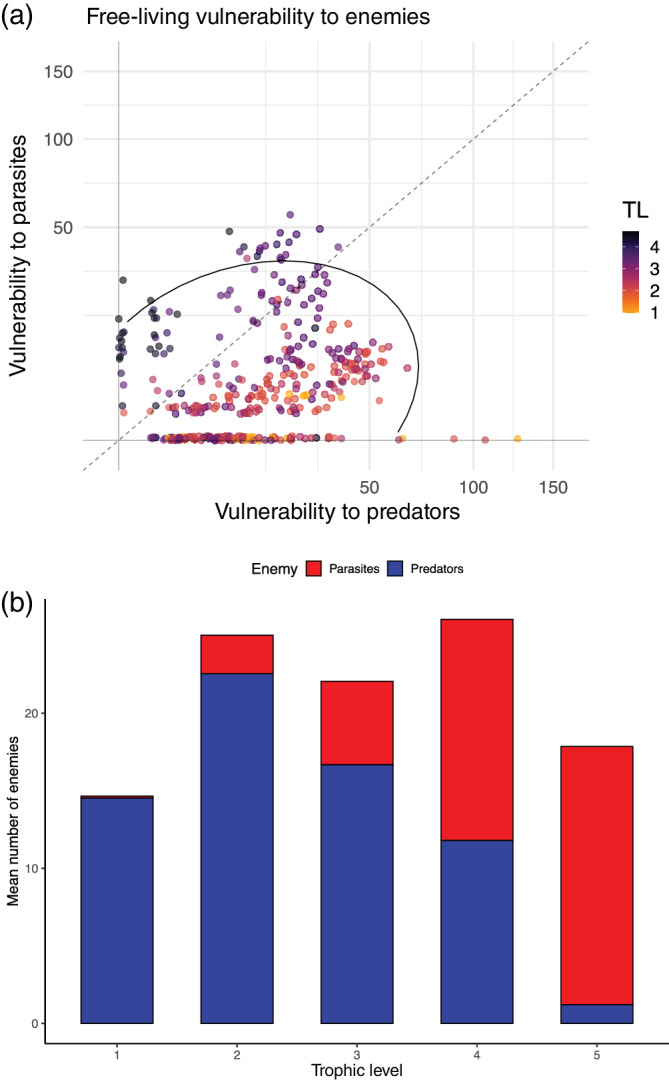
FIGURE 6.

Vulnerability by enemy type. (a) Vulnerability to parasites versus vulnerability to predators, color‐coded by trophic level (TL). The dashed 1:1 line represents equal vulnerability to parasites and predators; the ellipse represents 95% of the observations assuming a multivariate normal distribution. Most species had either relatively few natural enemies, many predators, or many parasites, and only mid‐level predators had many predator and parasite species. (b) Mean enemies per free‐living species (same data as panel a but binned by trophic level). Middle trophic levels (2–4) were most vulnerable overall. The average plant and grazer had very few parasites, whereas and the average top predator had many parasites and few predators
