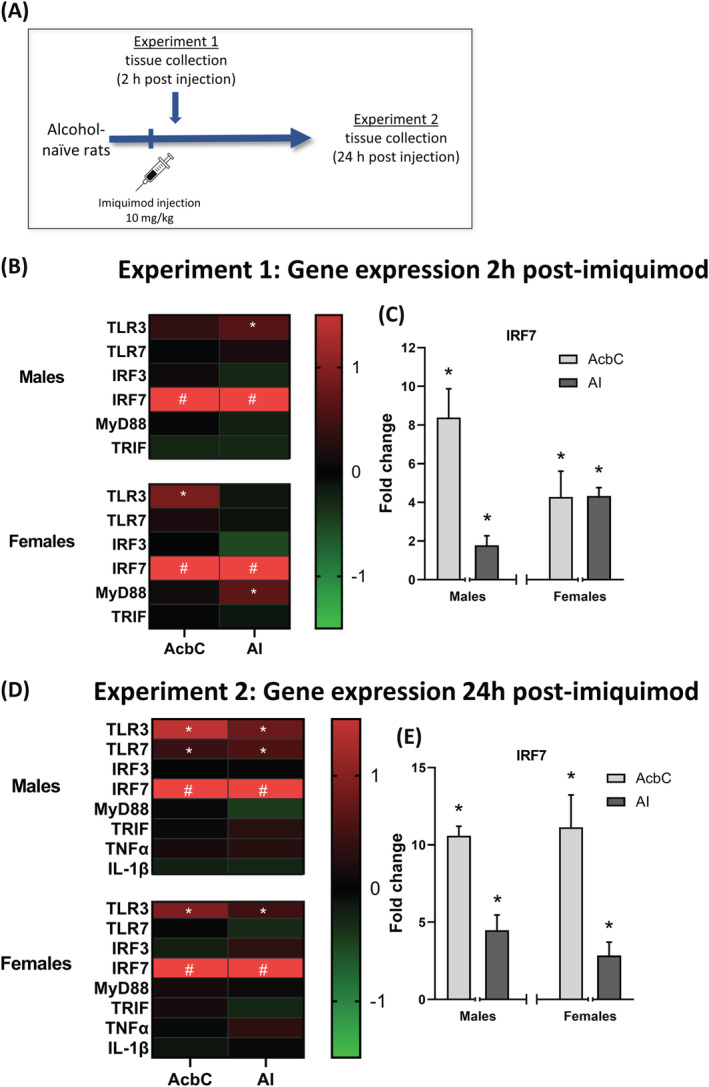
FIGURE 1.

Experiment 1 and 2 gene expression. (A) Rats were given an injection of either imiquimod (10 mg/kg, IP) or vehicle and tissue was collected either 2 h (Experiment 1) or 24 h (Experiment 2) post‐injection. (B) Experiment 1 gene expression changes in the nucleus accumbens core (AcbC) and anterior insula (AI) induced by imiquimod relative to controls visualized as a heatmap. (C) As IRF7 changes were much greater than seen in other genes these data are shown separately as fold change from vehicle controls (where vehicle group = 0 fold change). (D) Experiment 2 gene expression changes visualized as a heatmap. At 24‐h post‐injection, TLR3 was reliably increased across both brain regions and sexes. (E) IRF7 gene expression remained high 24‐h post‐injection. *p < 0.05 compared with vehicle control, #p < 0.05 compared with control and value is greater than the heatmap scale
