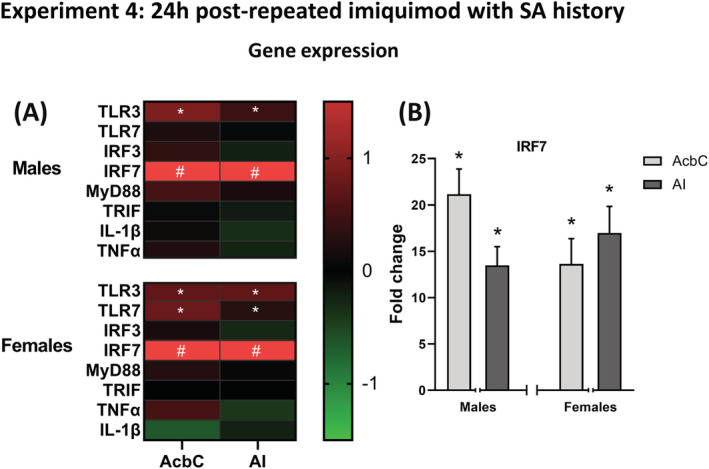
FIGURE 4.

Experiment 4 gene expression. (A) Experiment 4 gene expression changes in the (AcbC) and AI induced by imiquimod relative to controls visualized as a heatmap, showing consistent increases in TLR3 and IRF7 across brain regions in both sexes. (B) Multiple injections of imiquimod resulted in greatly increased expression of IRF7 in both brain regions and sexes. *p < 0.05 compared with vehicle control, #p < 0.05 compared with control and value is greater than the heatmap scale
