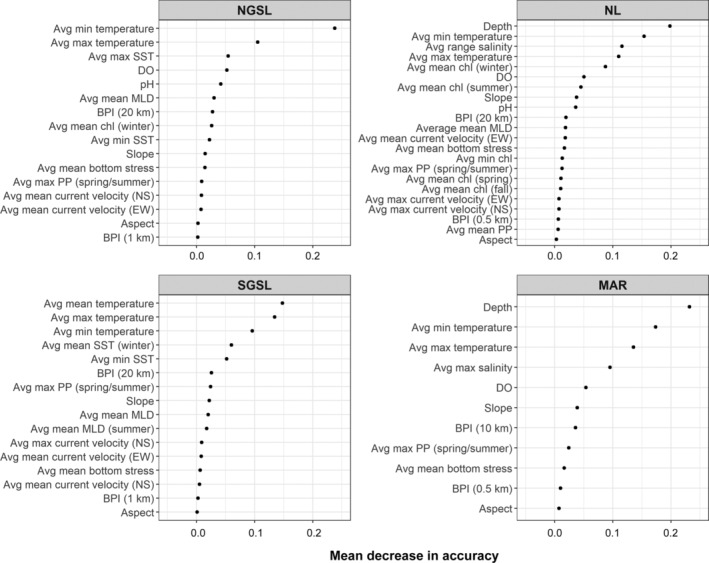
FIGURE 4.

Variable importance plots indicating mean decrease in whole model accuracy resulting from randomly permuting values of environmental predictors among observations used in the four regional random forest classifiers: NGSL, SGSL, NL, and MAR (see Figure 1 caption for regional abbreviations). Variable summaries with prefix “Avg” indicate averages across years with available data. Abbreviations are SST, sea surface temperature; DO, dissolved oxygen; MLD, mixed layer depth; BPI, bathymetric position index; NS, north‐south; EW, east‐west; chl, chlorophyll; PP, primary production. Refer to Appendix S1: Table S4 for details and data sources for individual variables
