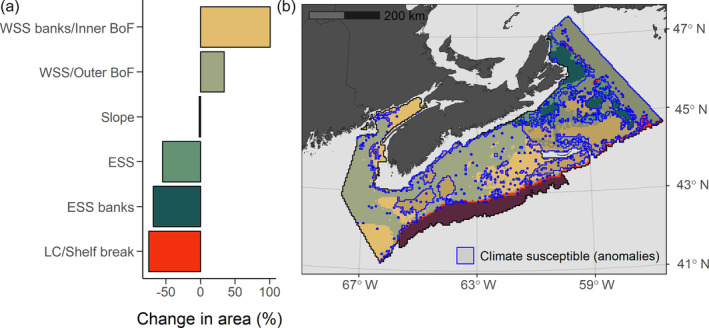
FIGURE 6.

(a) Predicted relative change in area encompassed by spatial distributions of the six predominant assemblage types in Maritimes region in 2075 with bottom temperature and salinity conditions projected under RCP 8.5. Data are difference in area between 2075 and present expressed as percentage of present area. (b) Predicted 2075 assemblage distributions. Assemblage types are identified by color hue. Regions with darker shading and blue outline indicate areas susceptible to change under projected warming (i.e., predicted classification in 2075 differs from present)
