
FIGURE 4.
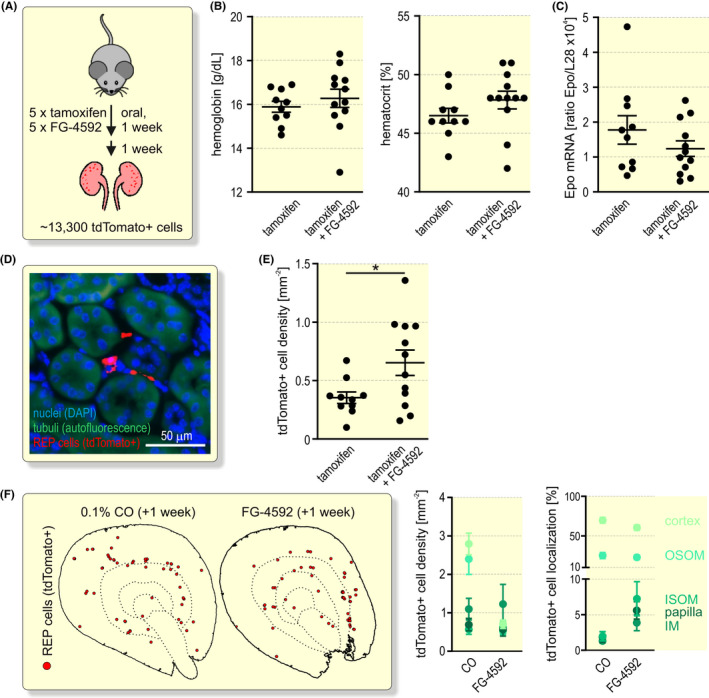
Pharmaceutical Epo induction by FG‐4592 (roxadustat). A, Schematic illustrating the conditional tagging of REP reporter cells by a combined gavage of 5 doses of tamoxifen alone or together with FG‐4592. Mice were analysed 1 week after the last dose. B, Haemoglobin and haematocrit measurement by whole‐blood spectroscopy of venous blood samples. C, Kidney Epo mRNA levels were determined by RT‐qPCR and are displayed relative to the ribosomal protein L28 mRNA levels. D, Detection of tdTomato+ REP cells. Tubuli were visualized by their autofluorescence (green) and nuclei were stained with DAPI (blue). E, Quantification of tdTomato+ REP cell density. Each data point represents the average value of 4 kidney slices derived from one mouse. B, C, E, Shown is the average per group ± SEM. Student’s unpaired t test were used to statistically evaluate changes versus the tamoxifen‐treated controls (*P < .05). F, Spatial distribution of tdTomato+ REP reporter cells. Shown are marked cells from 1 or 4 consecutive kidney sections one week after treatment with CO or FG‐4592, respectively (left panel). Automated quantification of tdTomato+ REP cells in the cortex, outer and inner segments of the outer medulla (OSOM and ISOM, respectively), inner medulla (IM) and papilla. In total, 660 tdTomato+ cells of 12 FG‐4592 treated mice were analysed and are shown as cell density and percentage distribution (right panel). The data of the CO‐exposed mice were duplicated from Figure 2