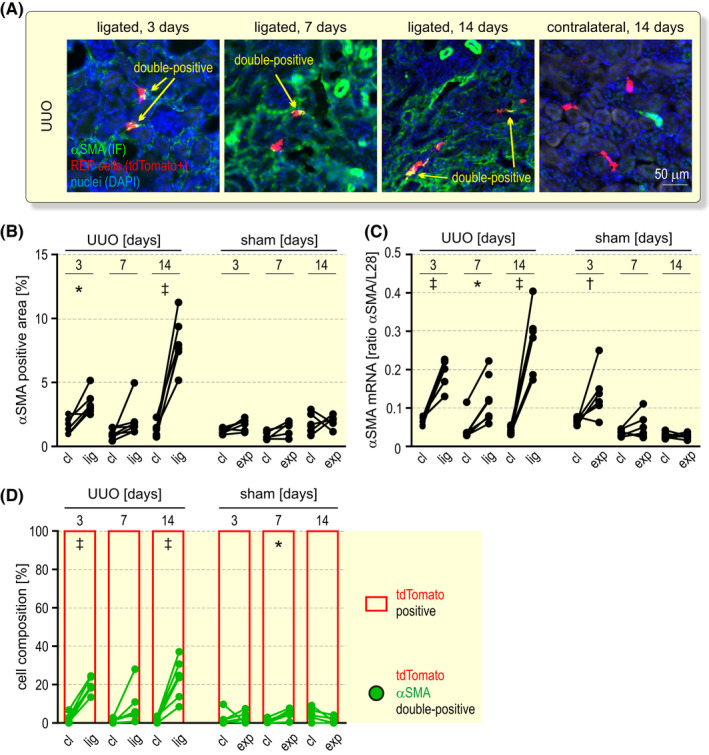
FIGURE 6.

Transdifferentiation analysis of REP cells during fibrotic tissue remodelling. A, αSMA immunofluorescence (IF; green) after 3 to 14 days unilateral ureteral obstruction (UUO) as outlined in Figure 5A. REP reporter cells were tagged by tdTomato (red) and nuclei were stained with DAPI (blue). Shown are exemplary areas containing tdTomato/αSMA double‐positive cells (yellow). B, Automated quantification of the αSMA+ area in the contralateral (cl) and ligated (lig) or sham‐operated exposed (exp) kidneys. C, Kidney αSMA mRNA levels were determined by RT‐qPCR and are displayed relative to the ribosomal protein L28 mRNA levels. D, tdTomato positive (red) and tdTomato/αSMA double‐positive (green) cell composition. Labelled cells were automatically counted and the values of at least 800 cells per timepoint are shown. B‐D, Repeated measures two‐way ANOVA followed by Bonferroni’s post‐hoc correction was used to statistically evaluate αSMA changes in ligated or exposed versus contralateral kidneys (*P < .05, † P < .01, ‡ P < .001)
