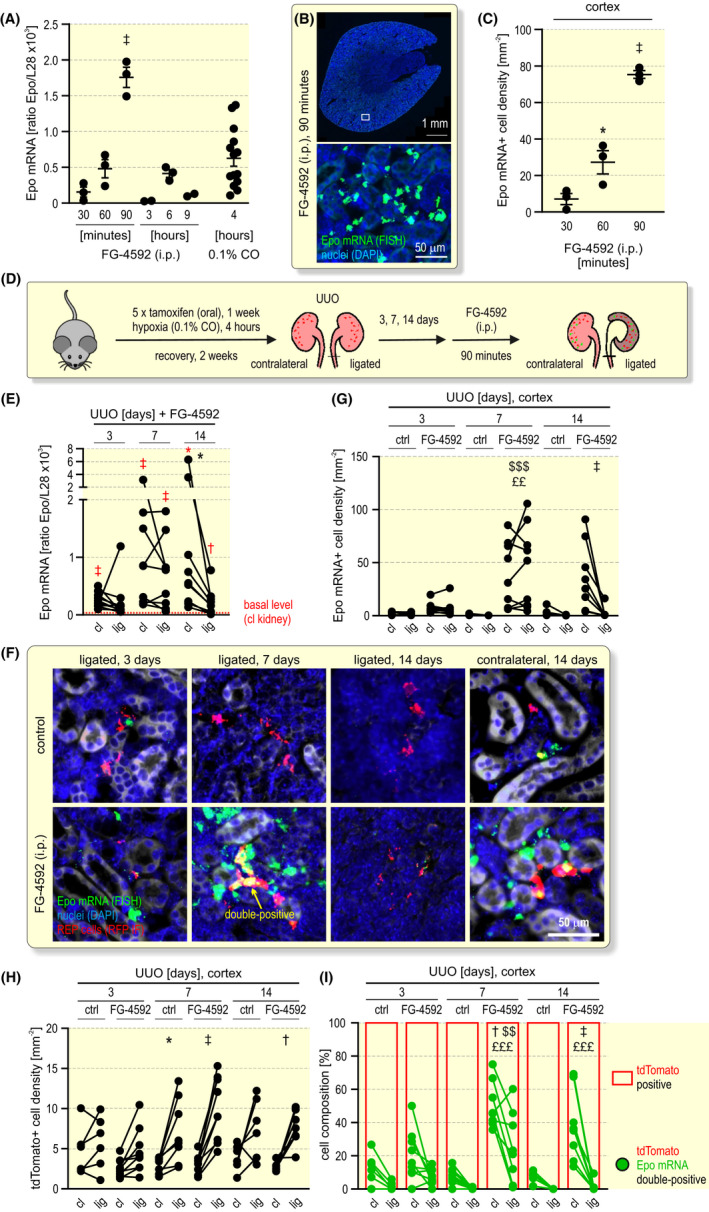
FIGURE 7.

FG‐4592 (roxadustat) treatment of mice with unilateral ureteral obstruction. A, Kinetics of Epo induction after a single intraperitoneal (i.p.) injection of 50 mg kg–1 FG‐4592 into Epo‐CreERT2#1xtdTomato mice. Kidney Epo mRNA levels were determined by RT‐qPCR and are displayed relative to the ribosomal protein L28 mRNA levels. For comparison, Epo mRNA levels after 4 hours of 0.1% CO exposure were included. B, Detection of Epo mRNA positive REP cells by FISH (green) 90 minutes after FG‐4592 treatment. Nuclei were stained with DAPI (blue). C, Quantification of Epo mRNA+ REP cells at the indicated time points after FG‐4592 treatment. A, C, One‐way ANOVA followed by Dunnett’s post‐hoc correction was used to statistically evaluate Epo induction versus the earliest (30 minutes) FG‐4592 treatment (average ± SEM; *P < .05, ‡ P < .001). D, Schematic illustrating the conditional tagging of REP reporter cells followed by unilateral ureteral obstruction (UUO) and a single i.p. injection of FG‐4592. Kidneys were excised 90 minutes later. E, Epo mRNA levels of contralateral (cl) and ligated (lig) kidneys, quantified as in (A); the dashed red line indicates the average basal Epo mRNA levels of the contralateral kidney of the non‐FG‐4592‐treated mice shown in Figure 5B. Student’s t tests were used to statistically evaluate Epo induction versus the basal Epo levels (*P < .05, † P < .01, ‡ P < .001; red symbols). Repeated measures two‐way ANOVA followed by Bonferroni’s post‐hoc correction was used to statistically evaluate Epo changes in the ligated versus contralateral kidneys (*P < .05). F, Detection of Epo mRNA+ (FISH, green) and tdTomato+ (anti‐RFP, red) REP cells. Quantification of Epo mRNA+ (G) and tdTomato+ (H) REP cell densities of untreated (ctrl) mice or following treatment with FG‐4592. Because of the loss of medullary tissue during UUO, this analysis focused on the cortex. The values of 120 to 800 cells per timepoint are shown. I, tdTomato positive (red) and tdTomato/Epo mRNA double‐positive (green) cell composition. G–I, Repeated measures three‐way ANOVA followed by Bonferroni’s post‐hoc correction was used to statistically evaluate Epo changes in the ligated versus contralateral kidneys (*P < .05, † P < .01, ‡ P < .001), in the FG‐4592 treated ligated versus untreated ligated kidneys ($$ P < .01, $$$ P < .001), and in the FG‐4592 treated contralateral versus untreated contralateral kidneys (££ P < .01, £££ P < .001)
