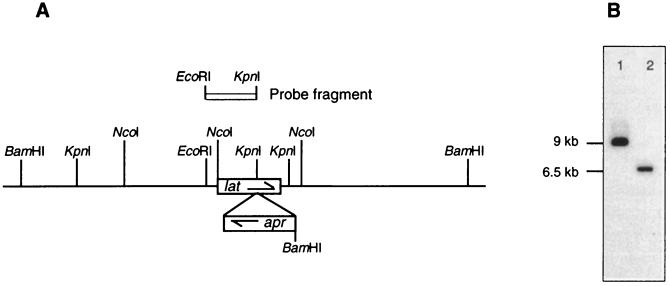
FIG. 3.
Disruption of the lat gene. (A) Diagram of the chromosome of a lat::apr gene disruption mutant in the region of the lat gene. Open boxes represent the lat and apr genes. Arrows indicate the direction of transcription. (B) Southern analysis of one of the lat::apr mutants (lat#2). Lanes 1 and 2, BamHI-digested genomic DNA from wild-type S. clavuligerus and the lat#2 mutant, respectively. The lat-specific probe fragment is shown in panel A. The sizes of hybridizing bands were determined by comparison with HindIII-digested lambda DNA (not shown).

