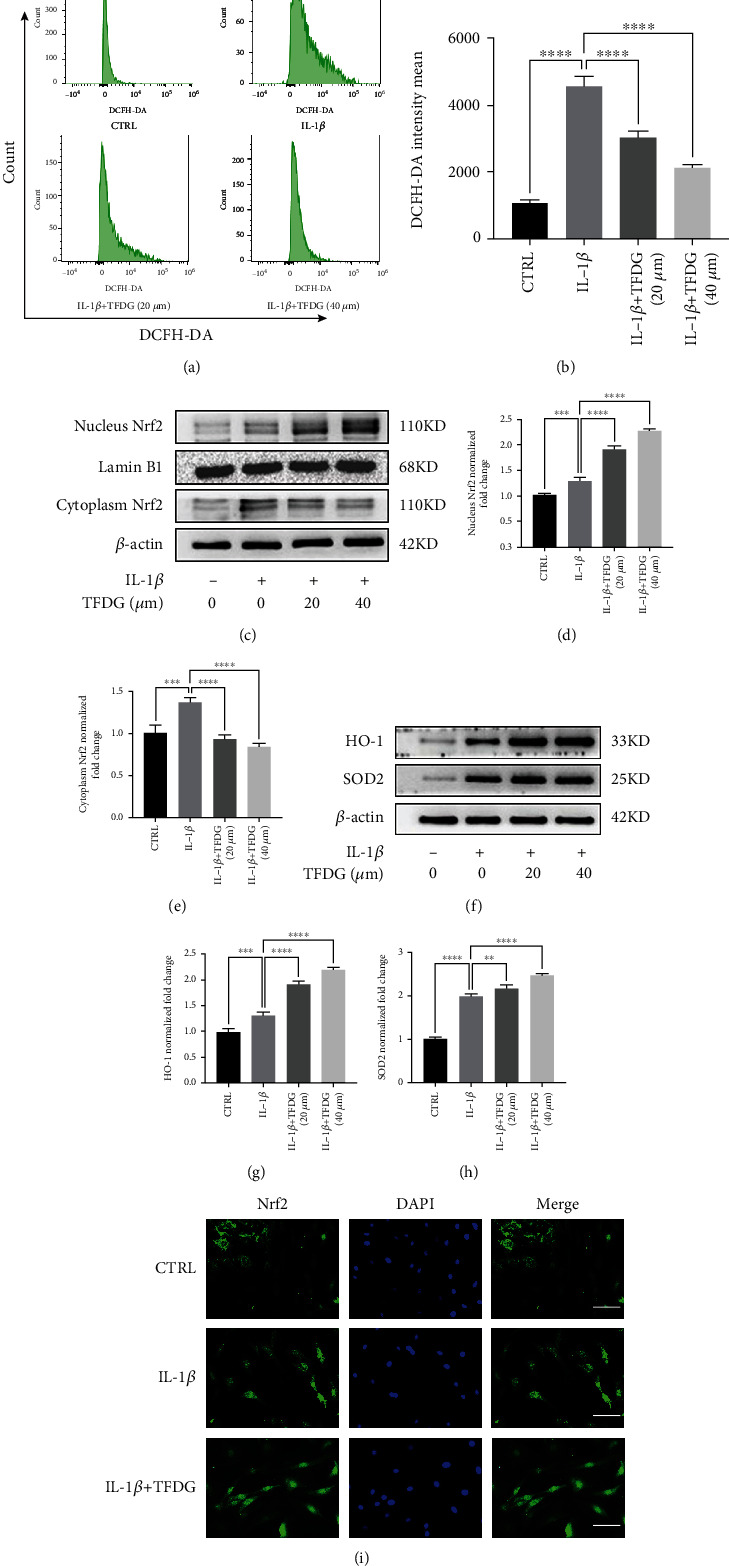
Figure 4.

TFDG reduces IL-1β-induced ROS accumulation by activating the Nrf2 pathway. (a and b) The intensity mean of ROS marked by DCFH-DA was quantified by flow cytometry. (c–h) The protein expressions of Nrf2 in nucleus and cytoplasm, HO-1, and SOD2 were analyzed by western blotting. The grey values of Nrf2 protein in nucleus normalized with Lamin B and other protein normalized with β-actin and control group were quantified by ImageJ. The bar graph shows the mean ± SD of data (n = 4). ∗p < .05, ∗∗p < .01, ∗∗∗p < .001, and ∗∗∗∗p < .0001. (i) Nrf2 protein expressions were detected by immunofluorescence. Scale bar: 100 μm.
