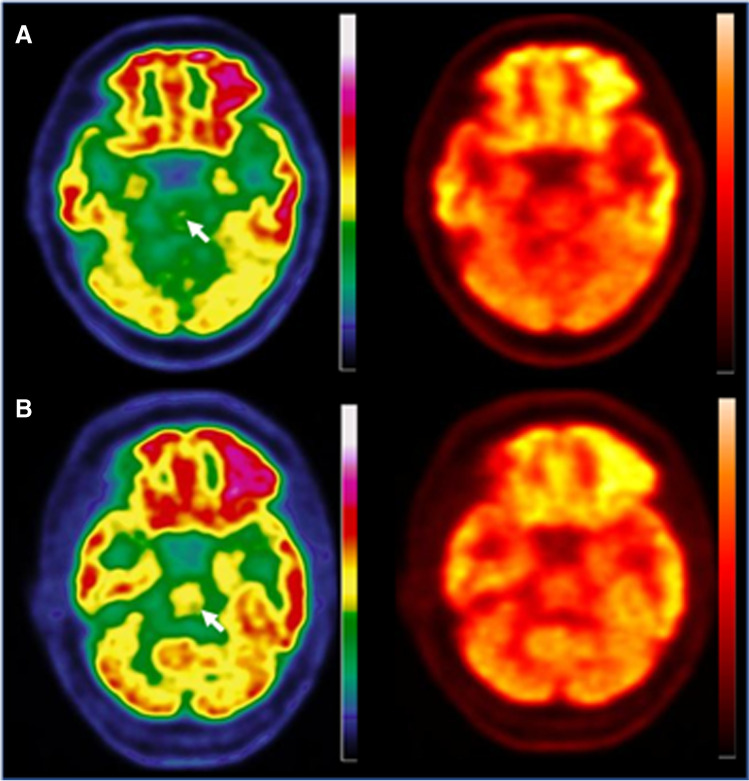
Fig. 2.
Axial slices of a brain FDG PET scan of a patient with a hypometabolic long COVID pattern (A) and in a patient with a normal brain scan (B). A discontinuous colour scale (left column) is better suited than a continuous scale (right column) to indicate hypometabolism in the pons (white arrow)

