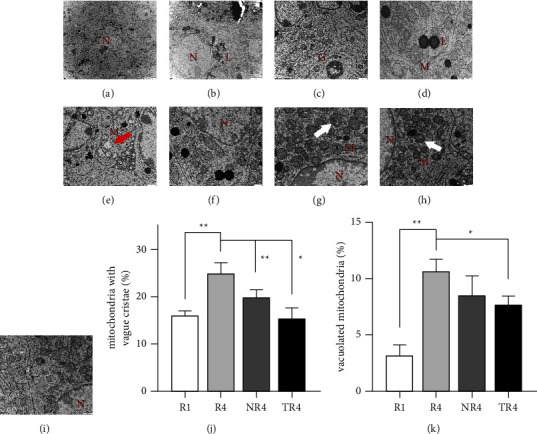
Figure 8.

Effect on ultrastructural changes of the ovarian granulosa cells of HSYC. (a–e) Normal ultrastructure in control group mice ovaries. (f–i) Representative images of mitochondria around the granulosa cells in each group, (f) R1 group, (g) R4 group, (h) NR4 group, and (i) TR4 group. (G: golgi complex; L: lipid; M: mitochondrial; N: nucleus of granulosa cells; white arrow: abnormal mitochondria; red arrow: vacuolated mitochondria). (j, k) The percentage of mitochondria with vague cristae and vacuolated mitochondria in all mitochondria.
