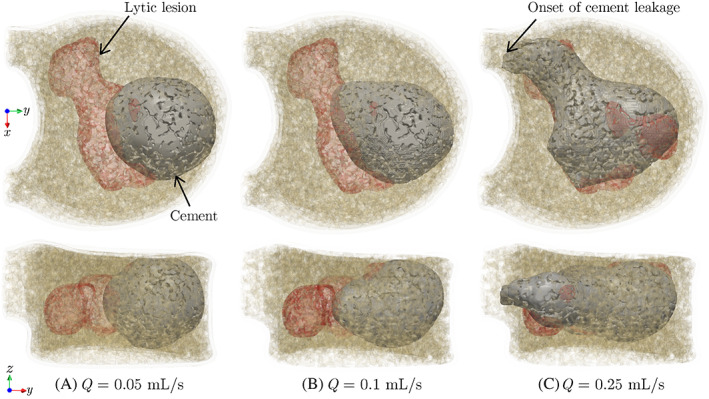
FIGURE 6.

Morphologies of 4.0 ml of cement injected into the vertebra model at different flow rates. Top and bottom rows show top and side views of the vertebral body, respectively

Morphologies of 4.0 ml of cement injected into the vertebra model at different flow rates. Top and bottom rows show top and side views of the vertebral body, respectively