
Fig. 3.
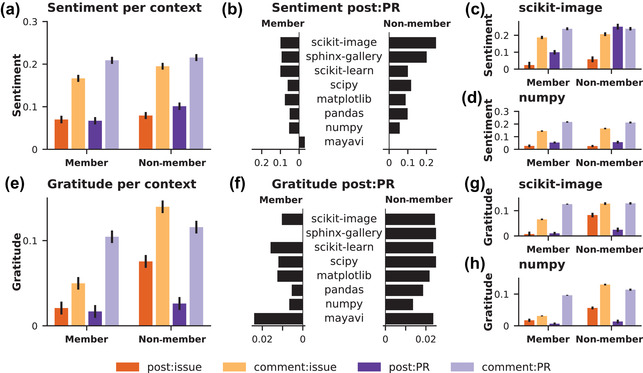
Summary visualizations of message sentiment (panels A and B) and gratitude (panels E and F) by context and membership. Community‐specific visualizations are provided for scikit‐image (panels C and D) and numpy (panels G and H). Context indicated by color: posted issue (dark orange), comment on an issue (light orange), posted PR (dark purple), or comment on a PR (light purple). Membership indicated by position: member (left panels) or non‐member right panels).