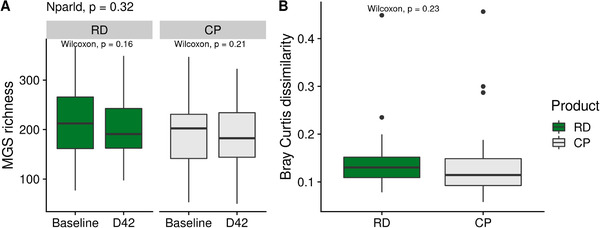
Figure 2.

Evolution in gut microbiota global composition between RD and CP. A) Comparison of MGS richness between baseline and D42 in the RD group or in the CP group. P‐values associated with paired Wilcoxon test are displayed. P‐value associated with the test for nonparametric longitudinal data (nparld, see Methods) is displayed at the top. B) Comparison of intraindividuals Bray–Curtis dissimilarity between the RD and the CP group. P‐value associated with Wilcoxon test is displayed. CP indicates control product; MGS, MetaGenomic species; RD, resistant dextrin.
