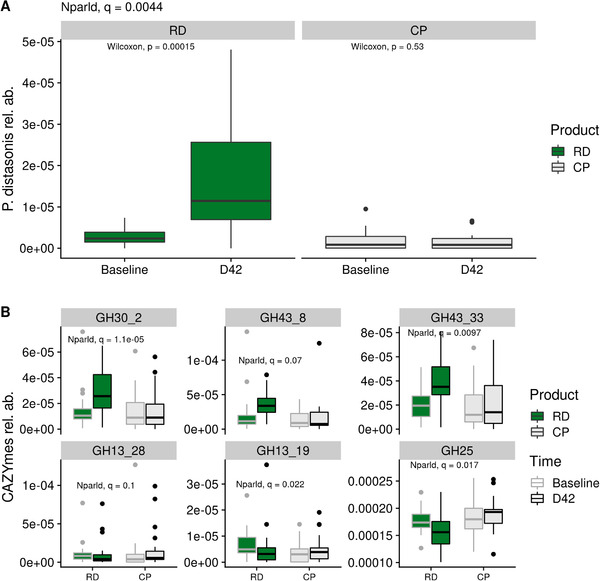
Figure 3.

Metagenomic features altered by RD intake. A) Evolution of the relative abundance of Parabacteroides distasonis in the RD and the CP group. P‐values associated with paired Wilcoxon test are displayed. Q‐value associated with the test for nonparametric longitudinal data (nparld, see Methods) is displayed at the top. B) Evolution if the six CAZymes impacted by RD intake. Q‐value associated with the test for nonparametric longitudinal data (nparld, see Methods) is displayed for each CAZymes. CP indicates control product; RD, resistant dextrin; rel. ab., relative abundance.
