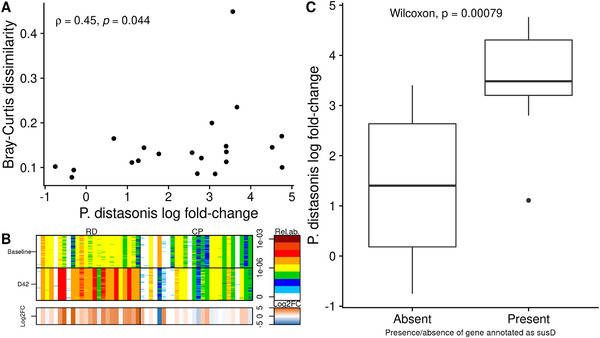
Figure 4.

Focus on Parabacteroides distasonis. A) Relation between P. distasonis log‐fold change and intraindividuals Bray–Curtis dissimilarity, considering only individuals from the RD group carrying P. distasonis (n = 21). Spearman's coefficient along with the associated p‐value are displayed. B) Barcode of P. distasonis in the RD group (left) or in the CP group (right), at baseline (top) or at D42 (bottom). The 50 “tracer” genes are in rows, abundance is indicated by color gradient (white, not detected; red, most abundant); individuals, ordered by increasing MGS richness, are in columns. The lowest bar gives the log‐fold change between baseline and D42 associated with each individual (i.e., each column). C) Difference in P. distasonis log‐fold change when comparing individuals from the RD group whose P. distasonis strain carries a specific gene annotated as SusD (n = 10) with individuals whose strain does not have this gene (n = 11). CP indicates control product; log2FC, log‐fold change; MGS, MetaGenomic species; RD, resistant dextrin.
