
FIGURE 2.
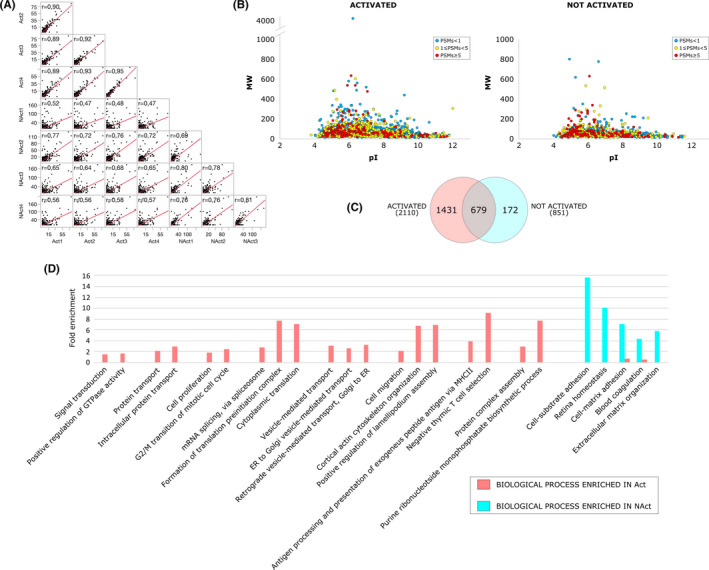
Proteomic analysis of MVs secreted by activated T cells (MV.Act) and by nonactivated T cells (MV.NAct). (A) Spearman's correlation comparing protein profiles from replicate analyses of MV.Act and MV.NAct. (B) Virtual 2DMap (pI vs. MW) of proteins identified in MV.Act or MV.NAct. (C) Venn diagram of the identified proteins. (D) Biological processes (BPs) differentially enriched in MV.Act (red bars) or MV.NAct (blue bars)