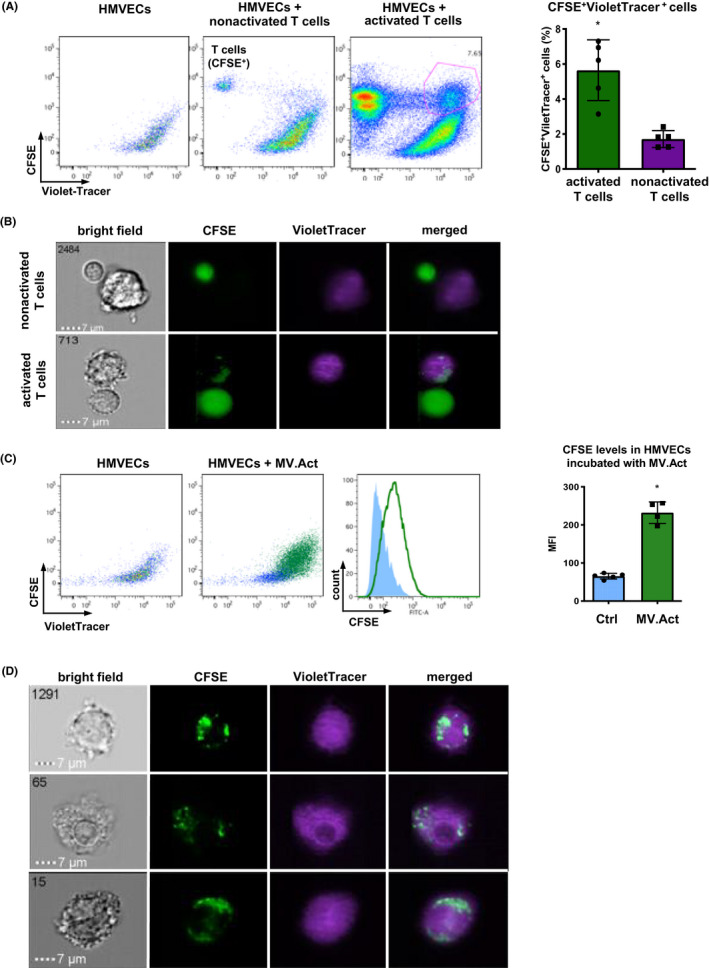
FIGURE 4.

Physical contacts of both T cells and MV.Act with HMVECs. (A) FACS representative plots showing VioletTracer‐labelled HCMVECs incubated with CFSE‐labelled activated or nonactivated T cells. Nontreated HCMVECs are shown as a control. Analyses were performed on day 3. Quantitative analysis of CFSE+VioletTracer+ population in co‐cultures. (B) ImageStreamX imaging flow cytometry of HCMVECs incubated with either activated or nonactivated T cells. Co‐localisation of CFSE+ T cell content (green) and VioletTracer+ HCMVECs was selectively observed using activated T cells. (C) Flow cytometry plots showing VioletTracer‐labelled HCMVECs incubated with CFSE‐labelled MV.Act. Quantitative analysis of CFSE levels in HCMVECs incubated with MV.Act and control HCMVECs (MFI, mean fluorescence intensity). (D) ImageStreamX imaging flow cytometry of VioletTracer‐labelled HCMVECs incubated with CFSE‐labelled MV.Act. Co‐localisation of CFSE+ T cell content (green) and VioletTracer+ HCMVECs can be seen (A, C graphs were analysed with the Student's t‐test for two independent groups, *p < .05)
