FIGURE 6.

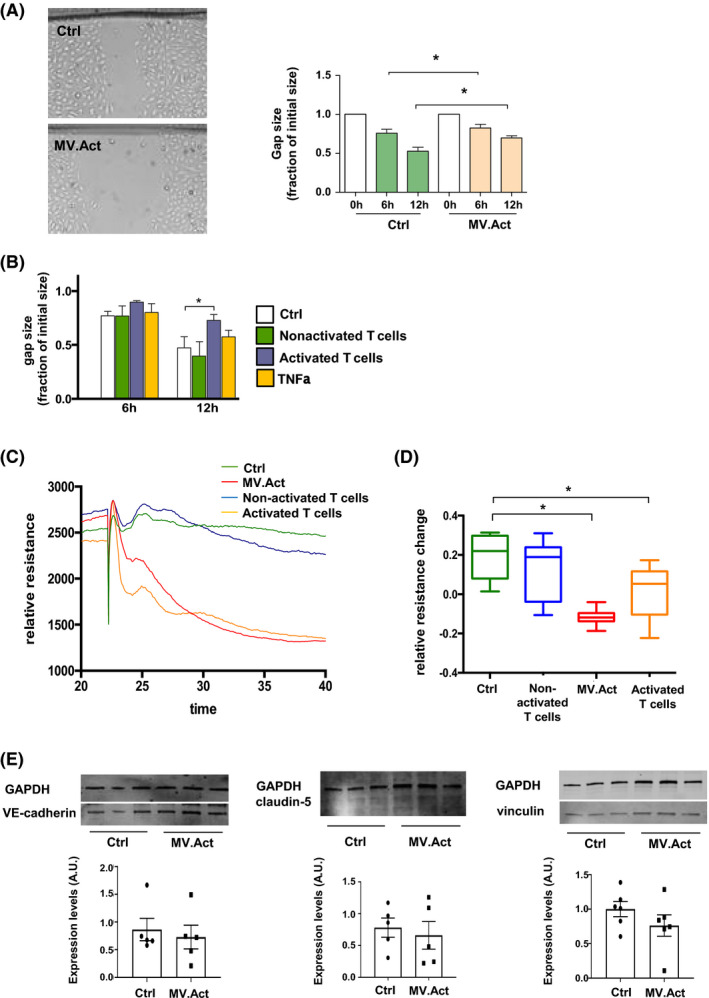
Effects of T cells and MV.Act on endothelial wound healing and endothelial barrier function. (A) Representative photomicrographs of HMVECs incubated with either MV.Act or no MVs (control) using a scratch assay. Quantitative analysis of endothelial monolayer gap closure at the indicated time points after scratch injury, normalised to 0 timepoint (data from n ≥4 experiments are shown). (B) Quantitative analysis of endothelial monolayer gap closure after cell incubation with either activated or nonactivated T cells, or after pretreatment with rhTNFα (data from n ≥4 experiments). (C) Trans‐endothelial electrical resistance (TEER) measured by ECIS technology in HMVECs incubated with either activated or nonactivated T cells, MV.Act, or in the absence of treatment (control). Relative resistance changes normalised for baseline conditions are shown. Representative individual real‐time TEER measurements in the different group are shown. (D) Quantitative analysis of TEER data (n = 8/group). (E) Western blot analysis and quantification of VE‐cadherin, claudin‐5 and vinculin in MV.Act‐treated conditions vs. control (data shown in A, B graphs were analysed using two‐way ANOVA, data shown in C graph were analysed using one‐way ANOVA, and data shown in E graph were analysed with the Student's t‐test, *p < .05)
