
FIGURE 7.
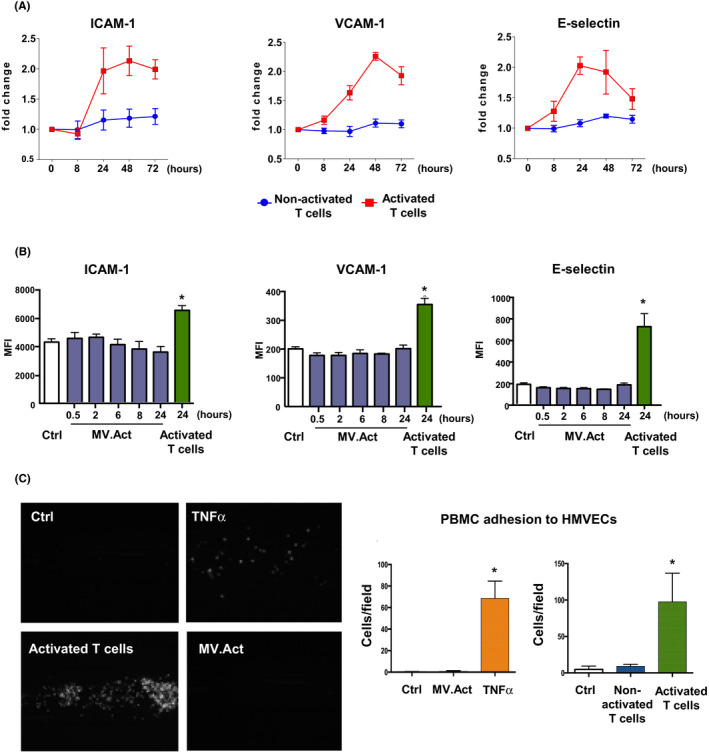
Adhesion molecule expression and leukocyte adhesion to by HMVECs. (A) Quantitative analysis of ICAM‐1, VCAM‐1 and E‐selectin expression on HMVECs incubated with either activated or nonactivated T cells for varying periods of time (n > 3). (B) Quantitative flow cytometric analysis of adhesion molecule expression on HMVECs incubated with MV.Act for varying time periods. Data on HMVECs incubated with activated T cells are shown as a positive control. (C) Left panel: Representative microphotographs of PBMC adhesion to HMVECs preincubated with either activated T cells or MV.Act, or pretreated with rhTNF‐α using a BioFlux system. Right panel: Quantitative analysis of PBMC adhesion (graphs were analysed with one‐way ANOVA, *p < .05)