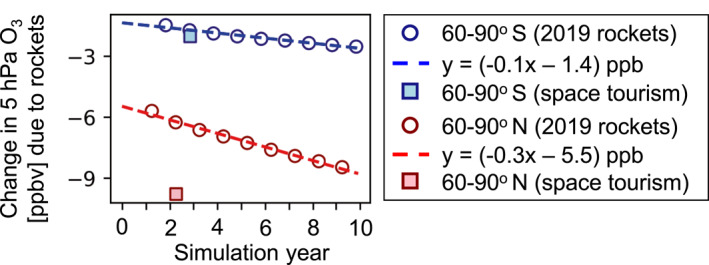
Figure 8.

High‐latitude springtime upper stratospheric O3 loss due to rocket launch and re‐entry emissions. Open circles show the O3 response to rocket emissions at 60–90° and 5 hPa altitude for years 2–10 of the decade‐long 2019 rocket emissions inventory simulation. Dashed lines show the linear least squares fit to these results. Filled squares show the springtime O3 loss due to space tourism emissions at the same altitude and latitude range.
