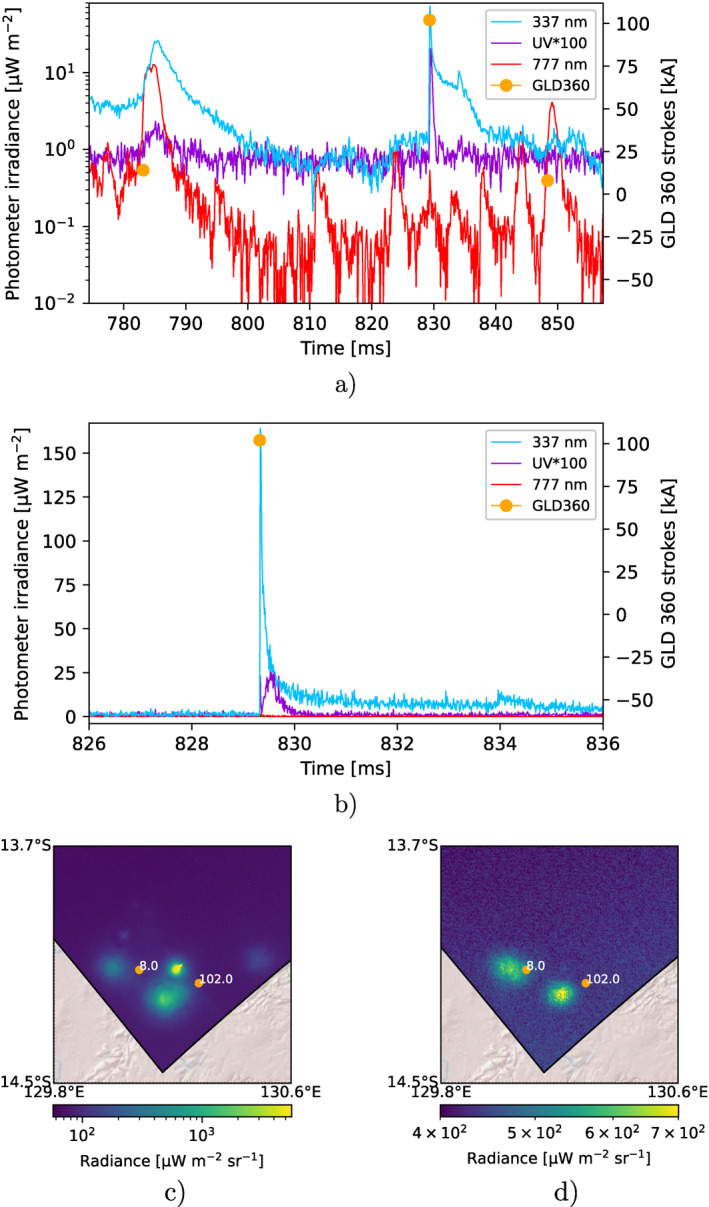
Figure 3.

Blue corona discharge in a developing cell. (a) Photometer signals corresponding to the blue pulse and accompanying ultraviolet and red signals, on logarithmic scale and 5‐point Gaussian filtered. Concurrent Global Lightning Detection network (GLD) strokes (dots) displayed on top. t = 0 corresponds to 30 January 2019 17:02:48.525 Universal Time Coordinated. The time range of the photometer matches the exposure time of the respective camera frame (∼83.3 ms). (b) Photometer signals around the blue corona discharge, on linear scale and non‐filtered. (c) 337.0 nm and (d) 777.4 nm camera images projected on an altitude of 16 km. GLD strokes occurring within the integration time are displayed on top. The display images are the cropped and downloaded Modular Multispectral imaging array images with the observed activity.
