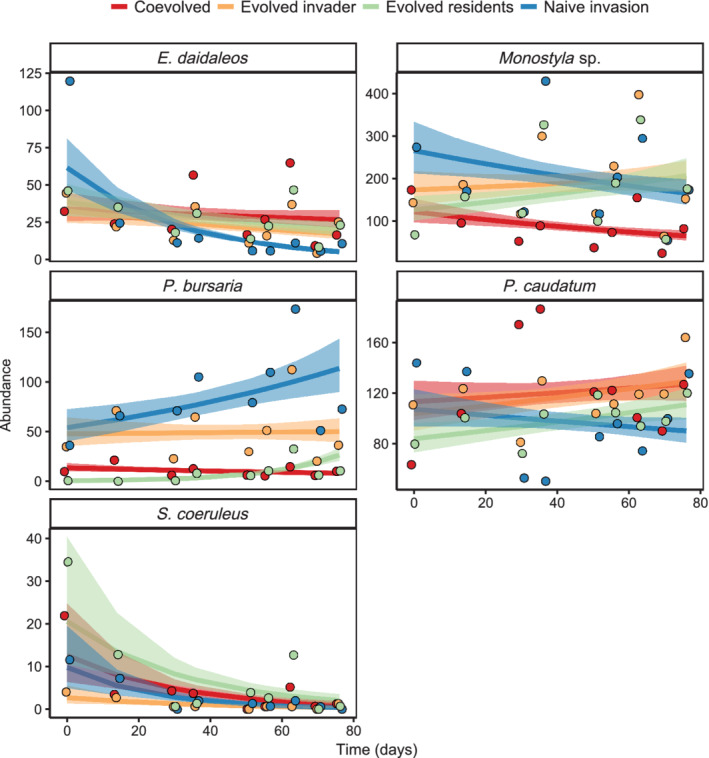
FIGURE 4.

Population dynamics of species within invaded communities of Assemblage B. Means and fitted lines with standard error are plotted. Model estimates were back transformed from a negative binomial glm. Points indicate the observed raw abundances, offset to help visualize the data
