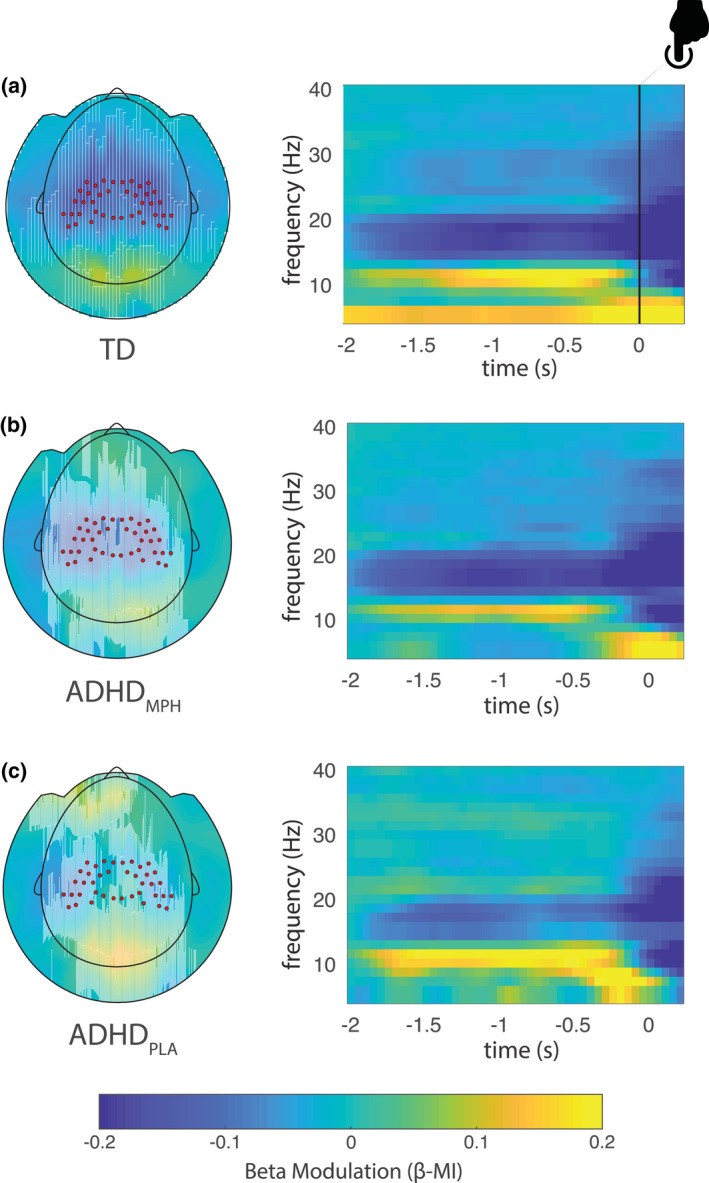
FIGURE 6.

Beta modulation indices in the three conditions (adapted from (Mazzetti et al., 2020)). Topographic plot (left) and respective time frequency representations (TFRs) (right panel) of power modulation (β‐MI) for the typically developing group (TD) (a), ADHDMPH group (b), and ADHDPLA group (c). Red dots superimposed on the topographies denote sensors of interest as defined in Figure 4a. Notably, beta preparation is stronger in the TD group, while progressively decreases in the ADHDMPH group, being weakest in the ADHDPLA group
