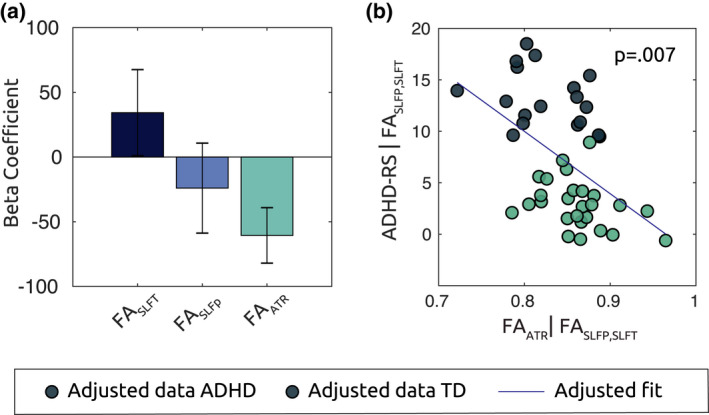
FIGURE 9.

FA In ATR predicts ADHD symptoms severity in all subjects. (a) Bar plot shows beta coefficients associated with mdl(2), where mean FA values along the tracts of interest are defined as predictors for ADHD‐RS symptoms score in all subjects. FAATR is associated with a significant partial regression coefficient (p = .007). Scatter plot in (b) show the adjusted response plot of symptoms as a function of FAATR, controlling for the variance explained the other predictors. Lower diffusivity along the ATR corresponded to higher average ADHD symptomatology along the spectrum
