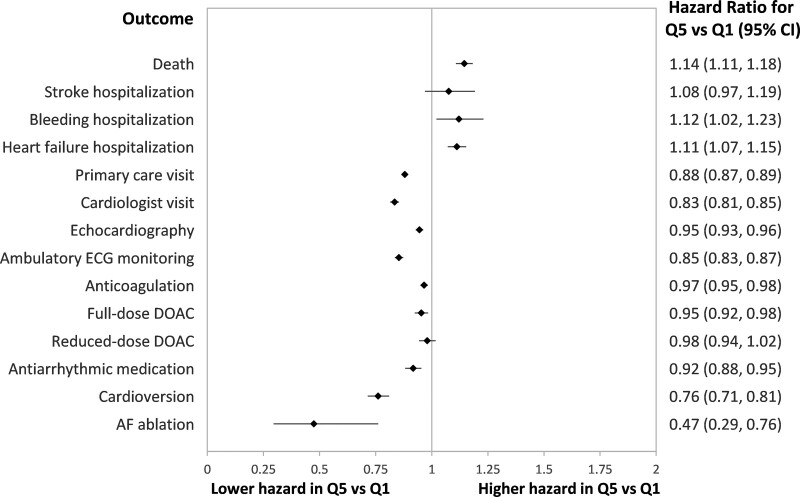
Figure 5.
Hazard ratios from cause-specific regression models comparing time to each of the outcomes listed among individuals with atrial fibrillation residing in neighborhoods with the highest quintile of material deprivation (Q5) relative to matched individuals residing in neighborhoods with the lowest quintile of material deprivation (Q1). Individuals were matched using propensity score methods as described in the text. DOAC indicates direct oral anticoagulant; and ECG, electrocardiogram.

