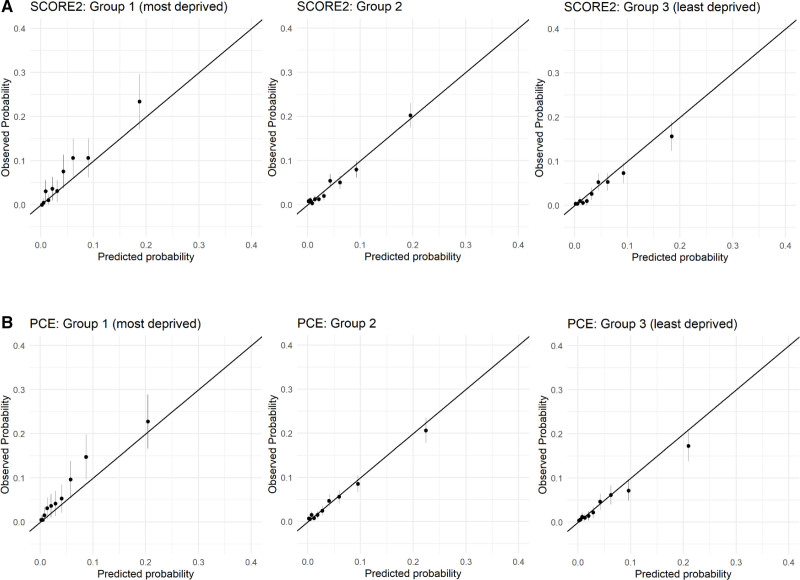
Figure 2.
Evaluation of the calibration of the recalibrated SCORE2 (Systematic Coronary Risk Evaluation 2 Algorithm) and Pooled Cohort Equations (PCE) risk scores using the predicted and observed 10-year risk, stratified by socioeconomic deprivation status. A, SCORE2 and (B) PCE. Each dot represents 1 decile of risk and is surrounded by the 95% CI.

