FIGURE 2.

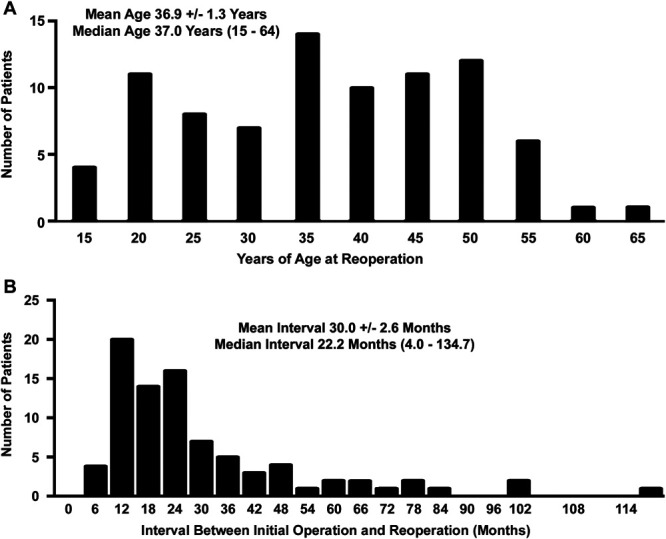
Distribution of the study population. A, Age distribution of patients in the study population. B, Distribution of patients according to the interval between the previous operation and reoperation.

Distribution of the study population. A, Age distribution of patients in the study population. B, Distribution of patients according to the interval between the previous operation and reoperation.