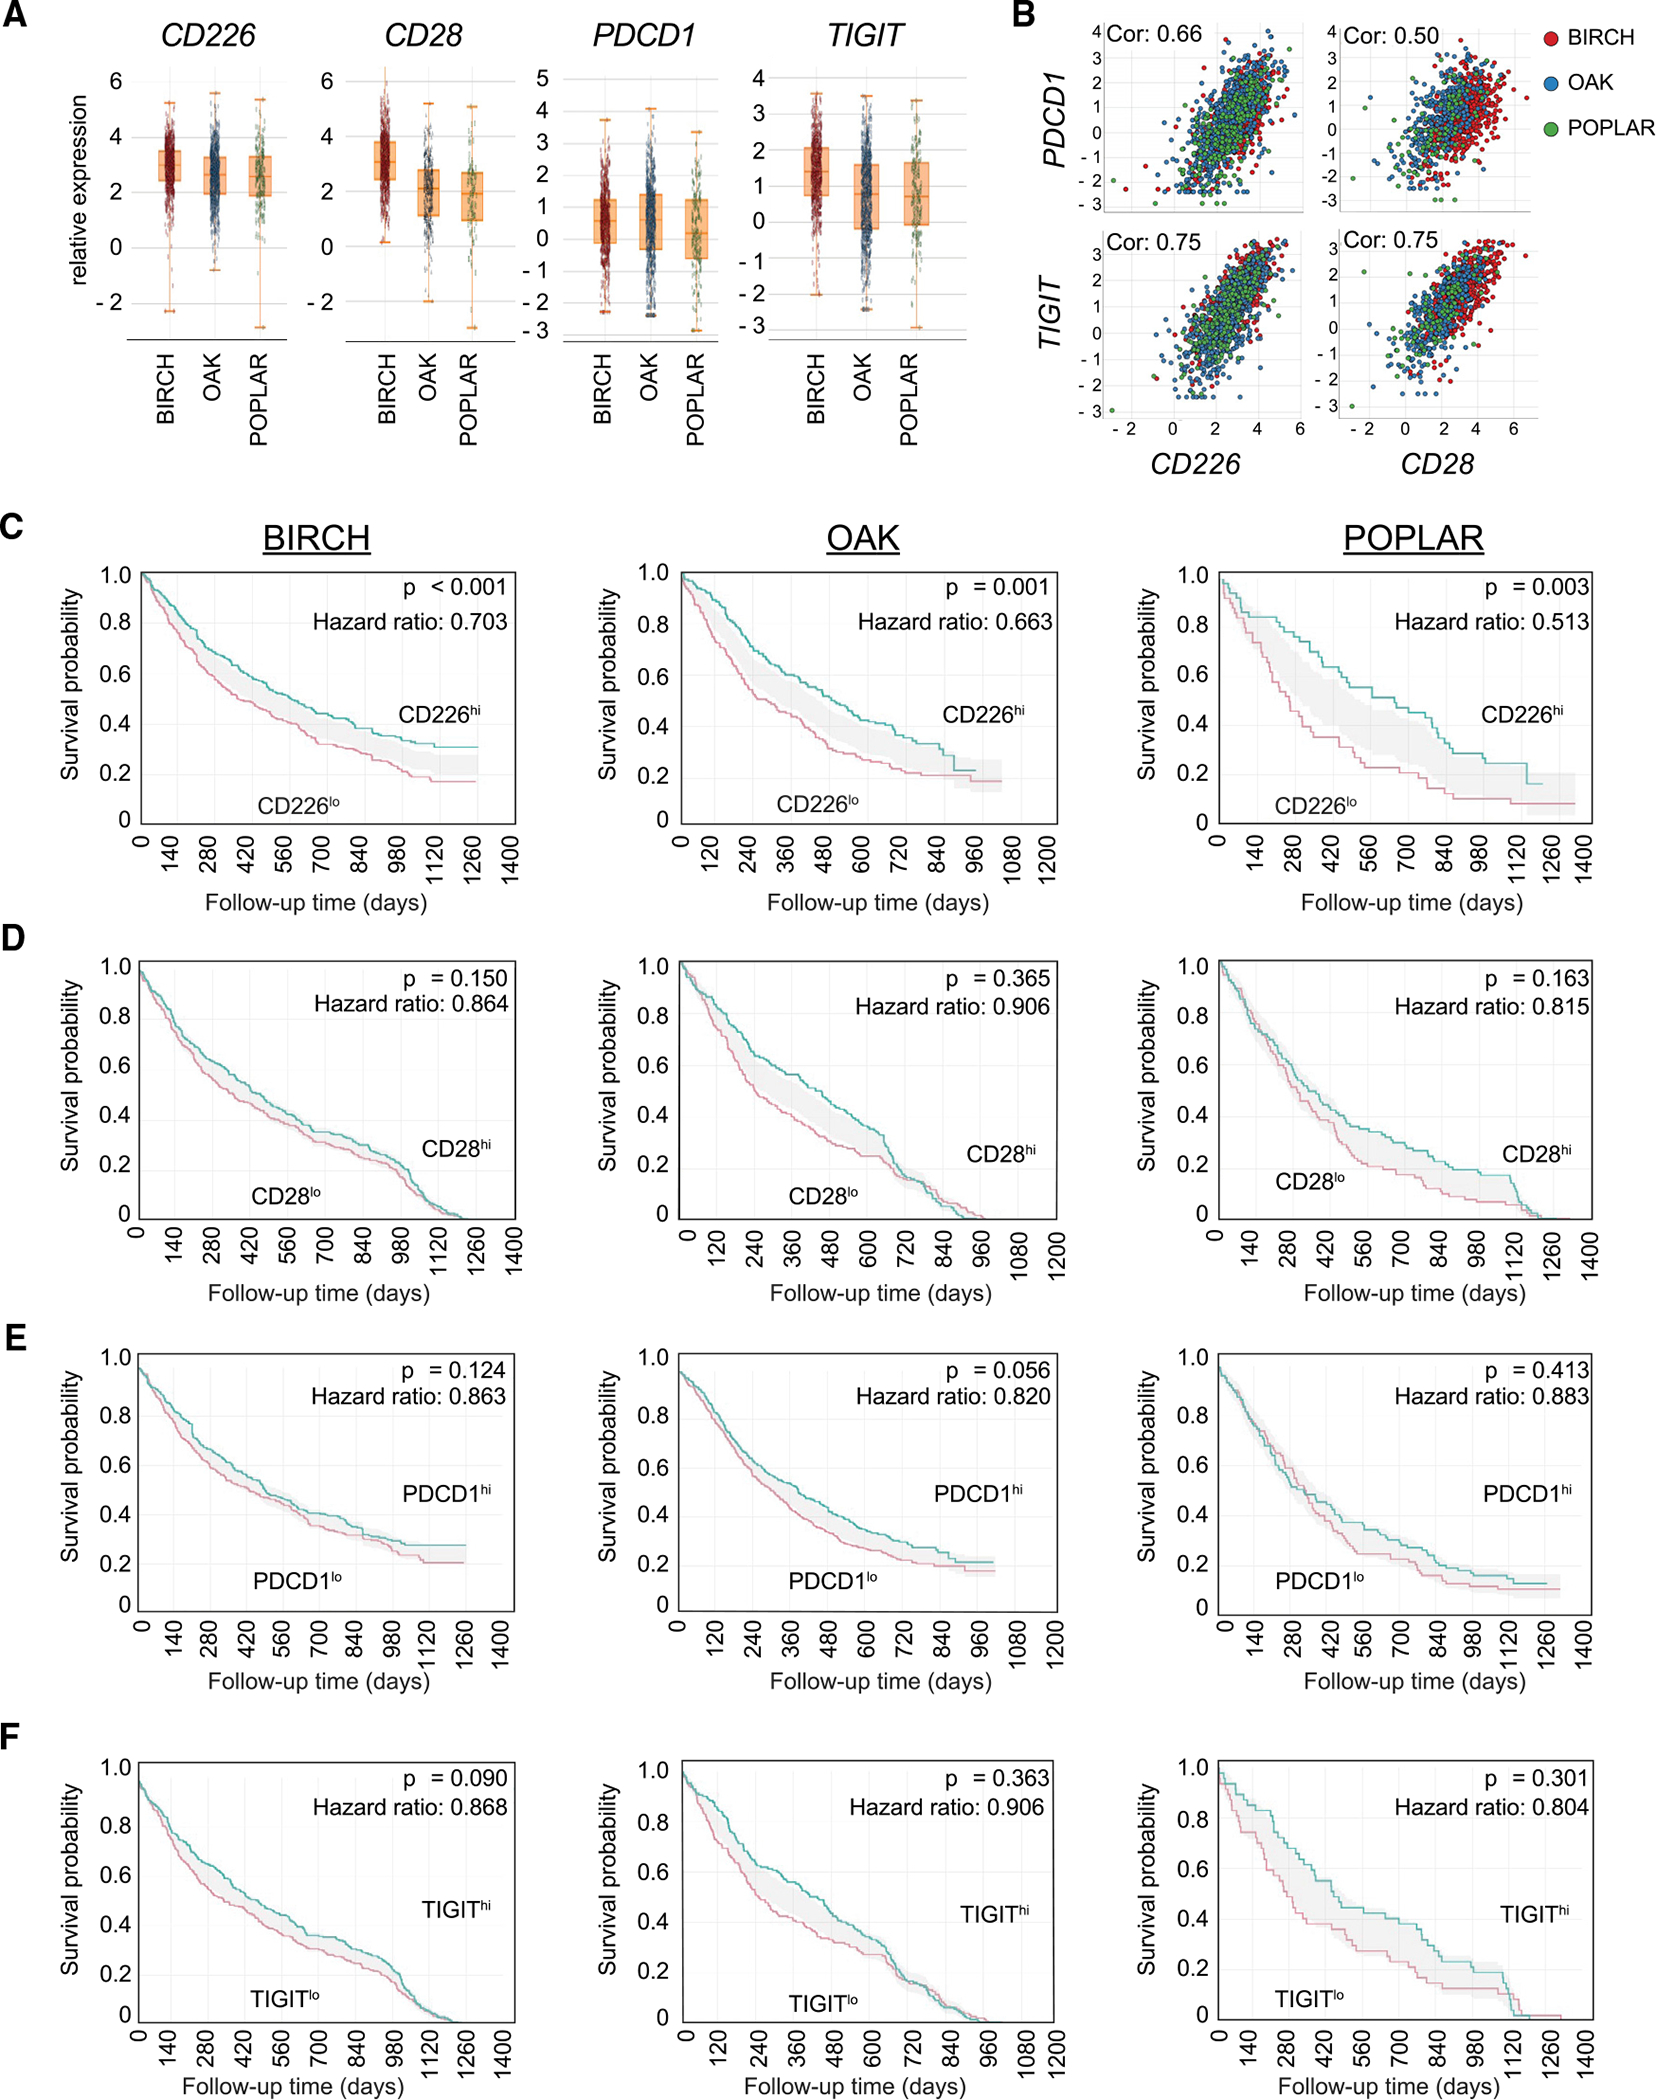
Figure 2. CD226 expression and association with clinical response to PD-L1 checkpoint blockade treatment in NSCLC.

(A) Relative gene expression of CD226, CD28, PDCD1, or TIGIT in three different atezolizumab clinical trials (BIRCH, OAK, or POPLAR) in NSCLC.
(B) Co-expression of CD226 (left) or CD28 (right) with PDCD1 or TIGIT are positively correlated. Shown is the Spearman correlation coefficient.
(C–F) Survival based on CD226 (C), CD28 (D), PDCD1 (E), or TIGIT (F) gene expression. Kaplan-Meier plots of overall survival (OS) are shown for the atezolizumab arm in the indicated clinical trial (BIRCH, OAK, or POPLAR), with patients separated on the basis of gene expression. Patients were dichotimized into top 50% (high, green line) or bottom 50% (low, red line) relative to the median expression over all patients in the corresponding clinical trial. Two-sided p values and hazard ratios from a Cox proportional hazards model are indicated for each plot.
