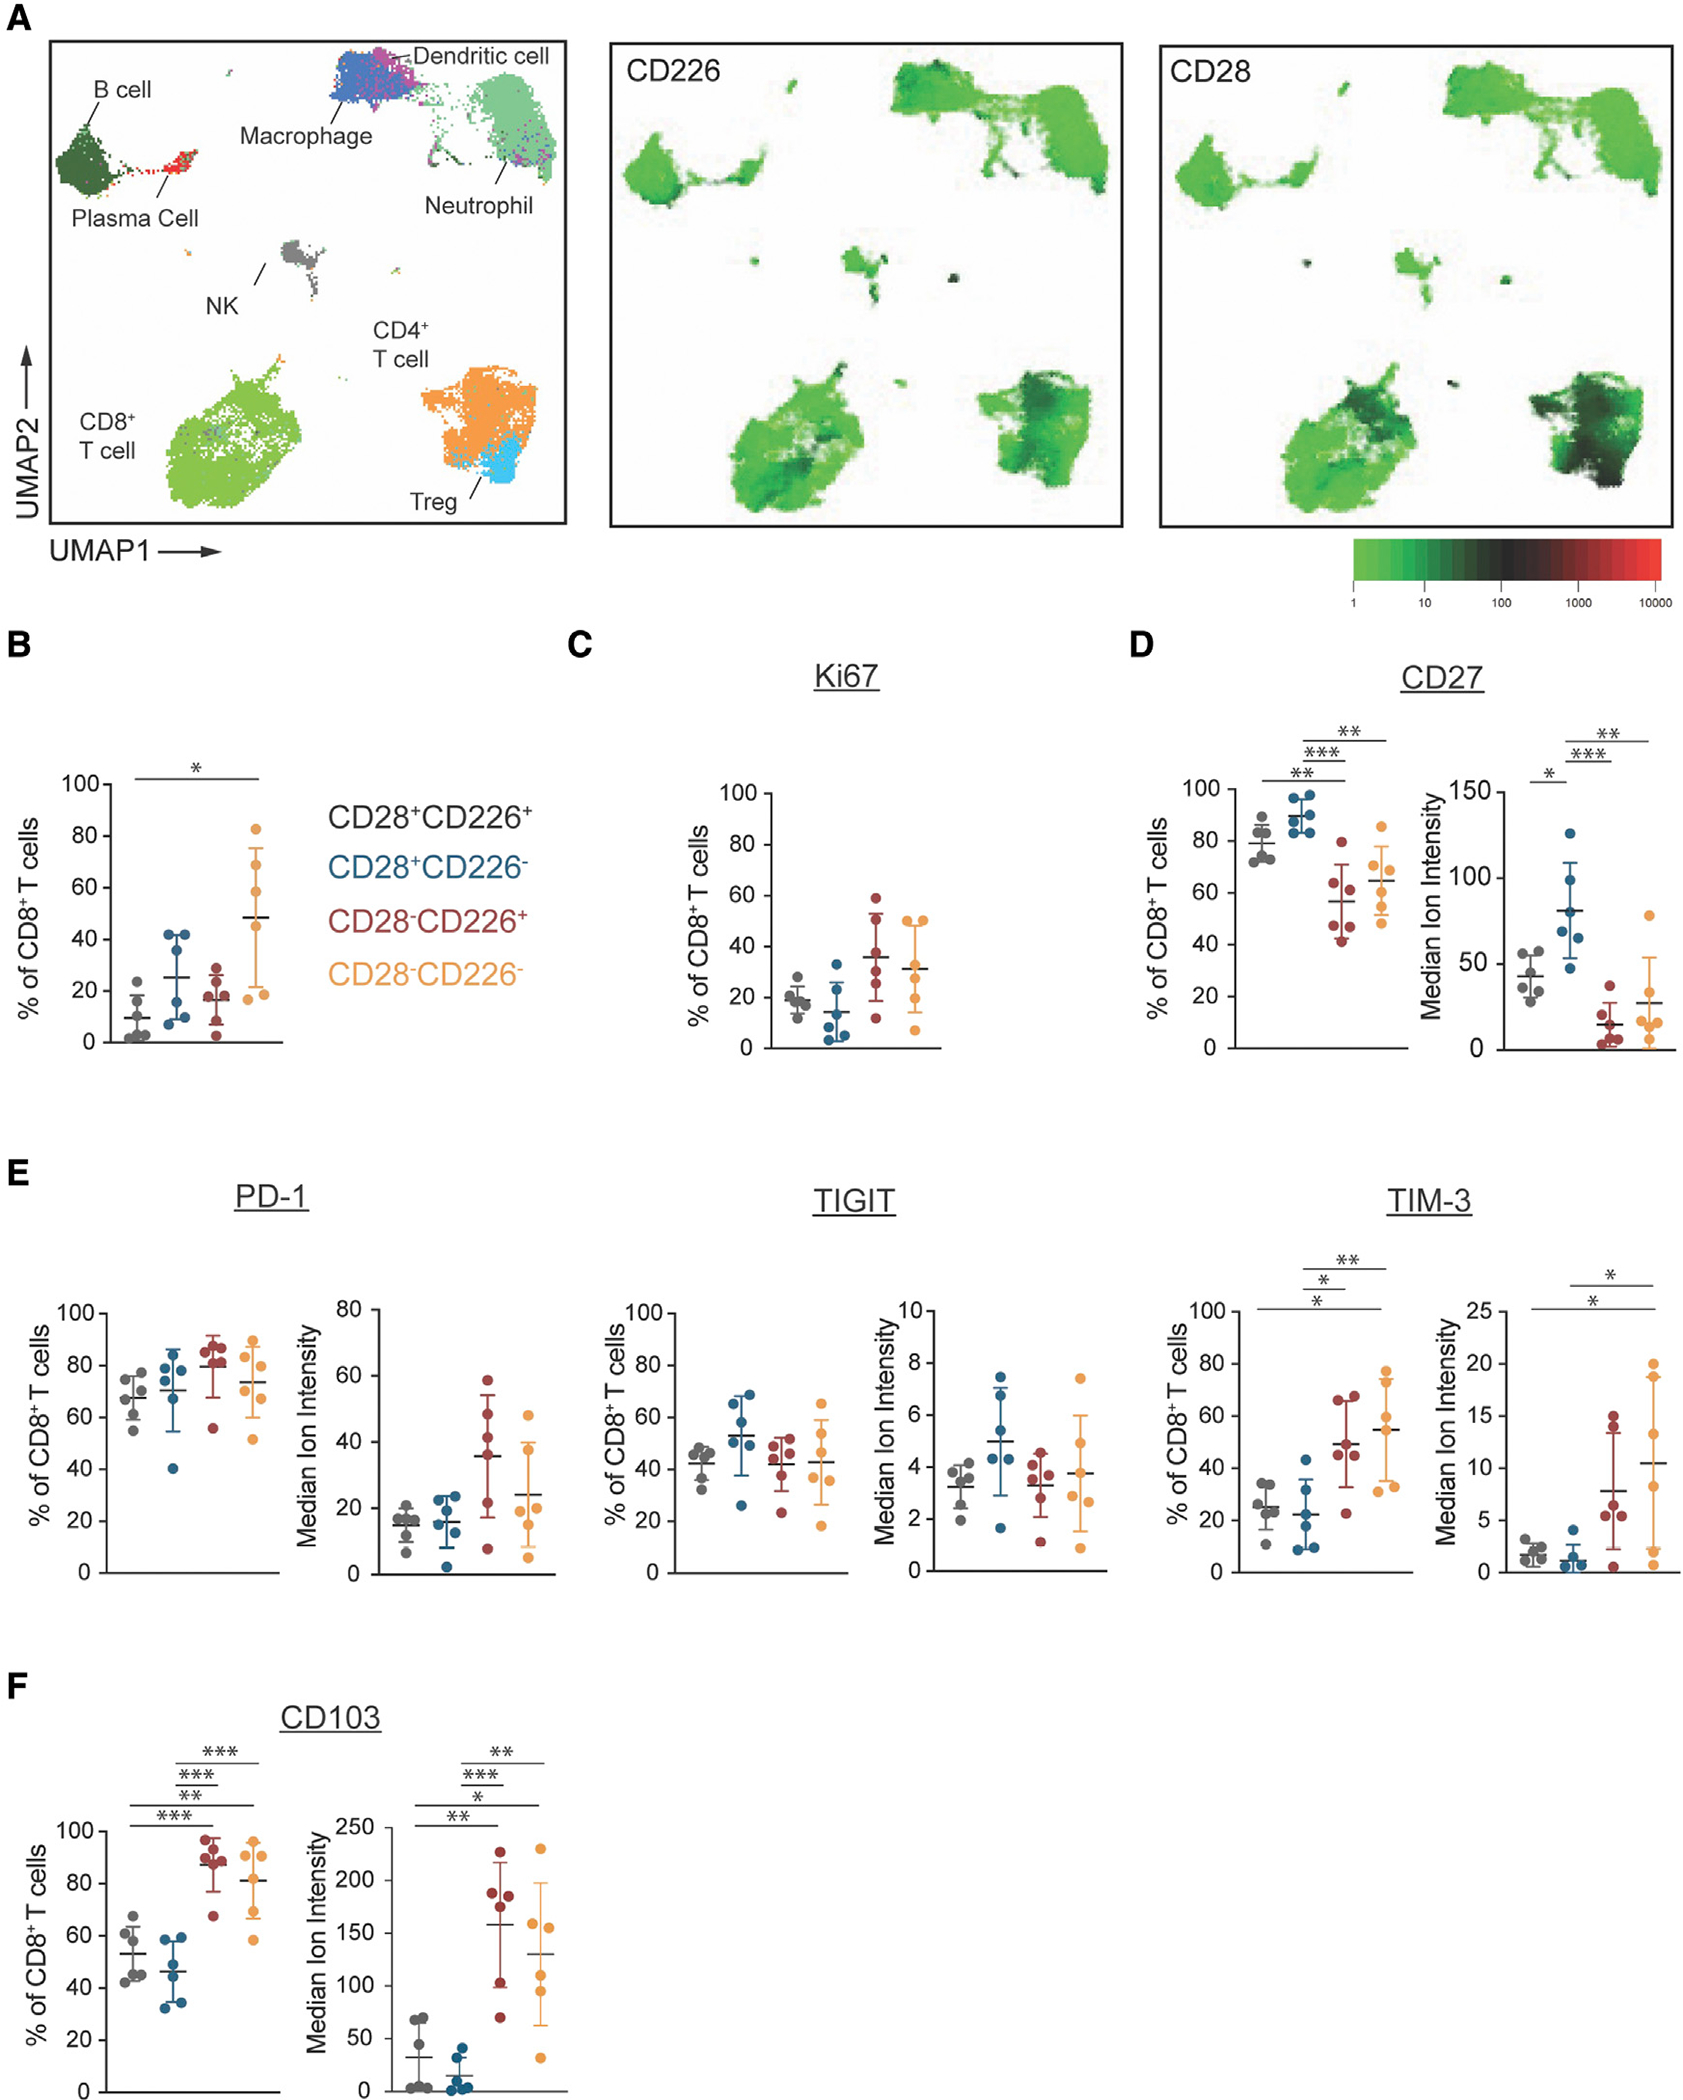
Figure 3. Expression of CD226 and CD28 in CD8+ T cells by CyTOF in NSCLC tumors.

(A) CD45+ cells from NSCLC patient tumors (n = 6) were analyzed by CyTOF. 8,000 downloaded cells per sample were aggregated and clusters generated in an unsupervised manner by uniform approximation and projection (UMAP). Immune cell populations were defined by manual gating and projected onto the UMAP (left). Expression of CD226 (middle) or CD28 (right) across total CD45+ cells was overlaid onto the UMAP.
(B) Frequencies of CD8+ T cell expressing CD226 and/or CD28 in NSCLC tumors. CD8+ T cells were subtyped by CD28+CD226+ (gray), CD28+CD226− (blue), CD28−CD226+ (red), or CD28−CD226− (yellow).
(C–F) Comparison of expression by frequency (left), and where shown, median ion intensity (right) for indicated markers within CD8+ T cells gated on CD226 and/or CD28 expression. (C) Proliferation marker Ki67. (D) CD27. (E) Checkpoint inhibitors PD-1, TIGIT, and TIM-3. (F) Trm cell marker CD103. Whiskers denote mean ± SD (n = 6). p values are shown for one-way ANOVA with post hoc Tukey’s for multiple comparisons; *p < 0.05, **p < 0.01, ***p < 0.001.
