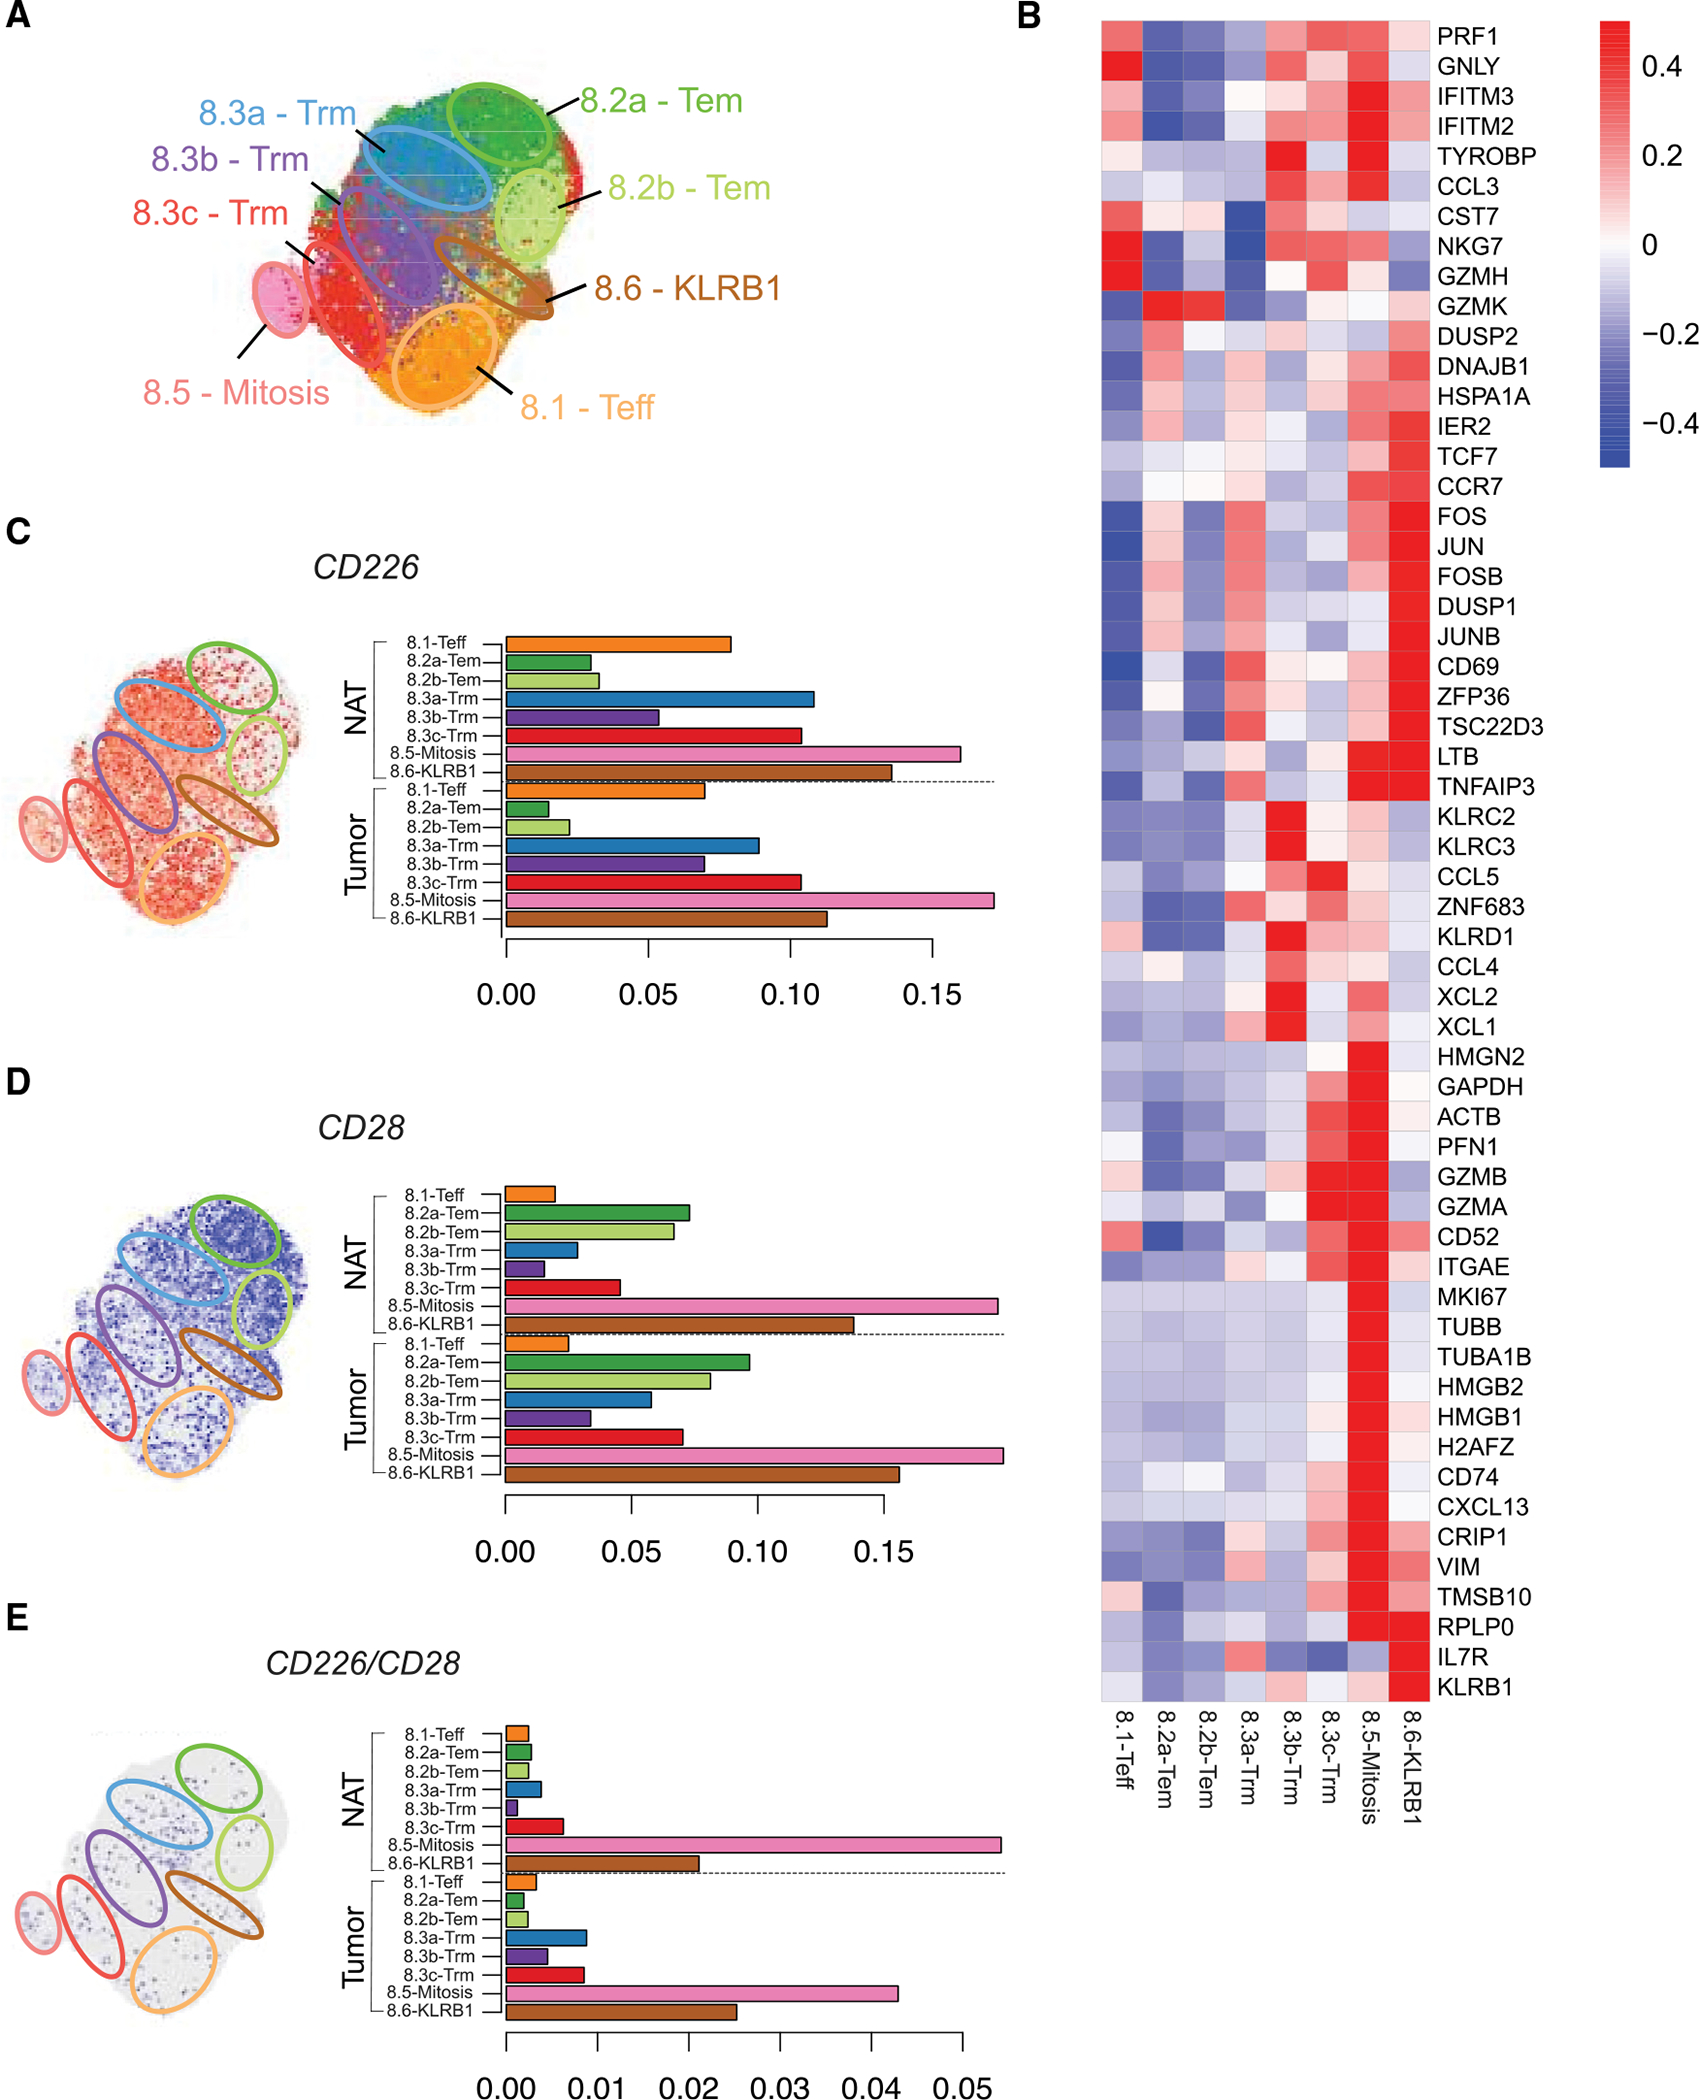
Figure 4. CD226 and CD28 expression in CD8+ T cells in NSCLC tumors by scRNA-seq.

(A) Cluster analysis was performed on scRNA-seq data of CD8+ T cells obtained from all six NSCLC patients and plotted by UMAP dimensionality reduction. Cluster assignments were generated by unsupervised clustering and colored by cluster assignment. Approximate regions of the clusters are demarcated with labeled ovals (top left).
(B) Relative expression of T cell-associated genes across CD8+ clusters.
(C–E) Individual CD8+ T cells are plotted within each UMAP (left) or plotted by bar graph to depict frequency (right) of CD226 (C), CD28 (D), or CD226 and CD28 (E) expression within each CD8+ T cell cluster.
