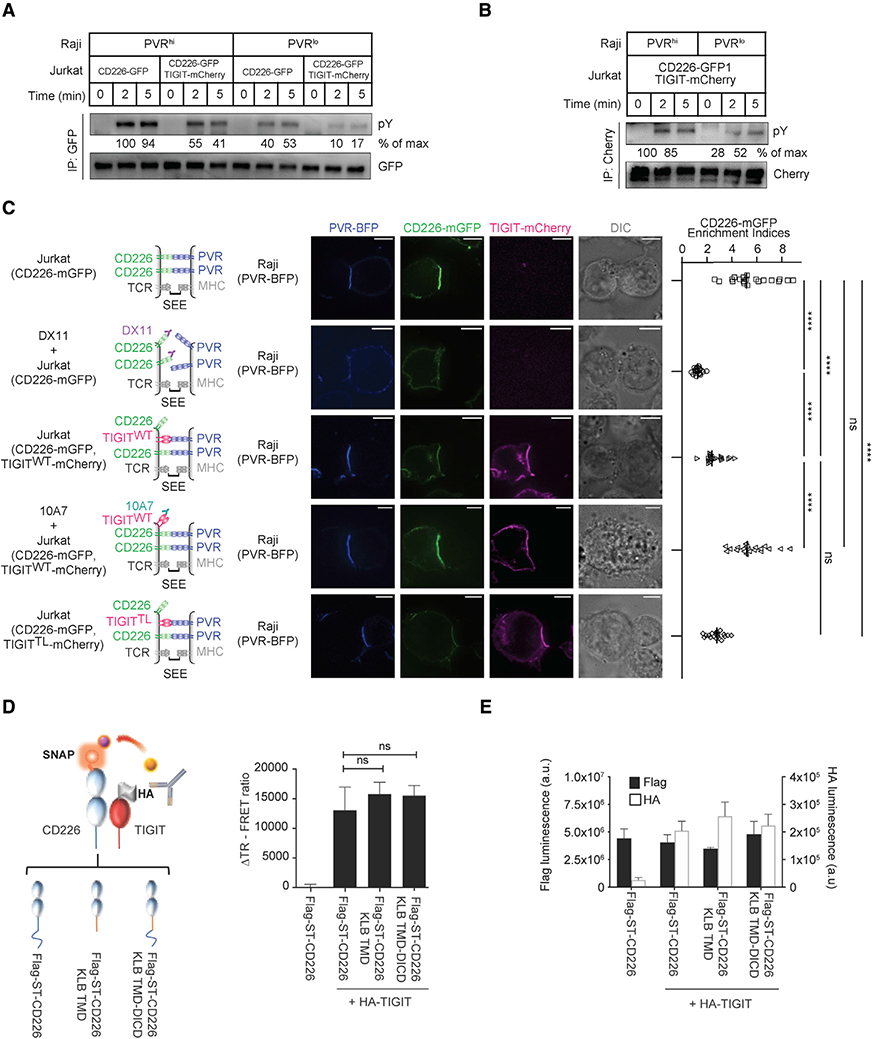
Figure 6. TIGIT inhibits CD226 through lateral associations through ECDs.
(A and B) Representative immunoblots showing the degrees of CD226 and TIGIT phosphorylation (pY) after co-culturing Jurkat cells expressing indicated receptors and SEE-loaded Raji cells expressing indicated ligands. Times denote the duration of co-culture before lysis. CD226-GFP and TIGIT-mCherry were captured using GFP IP and mCherry IP, respectively. The “% of max” values under each blot denote the OD of the corresponding bands above normalized to the OD of the strongest band of the same blot.
(C) Confocal images of Jurkat:Raji cell conjugates probing the effects of TIGIT on PVR-mediated CD226 accumulation to the Raji:Jurkat interface. Left: depiction of the relevant proteins at the cell conjugate. Middle: confocal and differential interference contrast (DIC) images of a Raji:Jurkat conjugate acquired five minutes after contact. Right: scatterplot summarizing CD226 enrichment indices of the five conditions (means ± SD, n = 20 conjugates from three independent experiments). Scale bars, 5 μm. ****p < 0.0001; ns, not significant; Student’s t test (n = 20).
(D and E) Interaction studies between CD226 and TIGIT using FRET. (D) Cell surface TR-FRET signal between acceptor labeled full-length or chimeric Flag-ST-CD226 and donor labeled full length HA-TIGIT. (E) Cell surface expression of Flag-ST-CD226 constructs (black bar) and HA-TIGIT (white bar) as measured by ELISA. Data are average of 2 independent experiments, each performed in triplicate, and shown as mean ± SEM ns = not significant.

