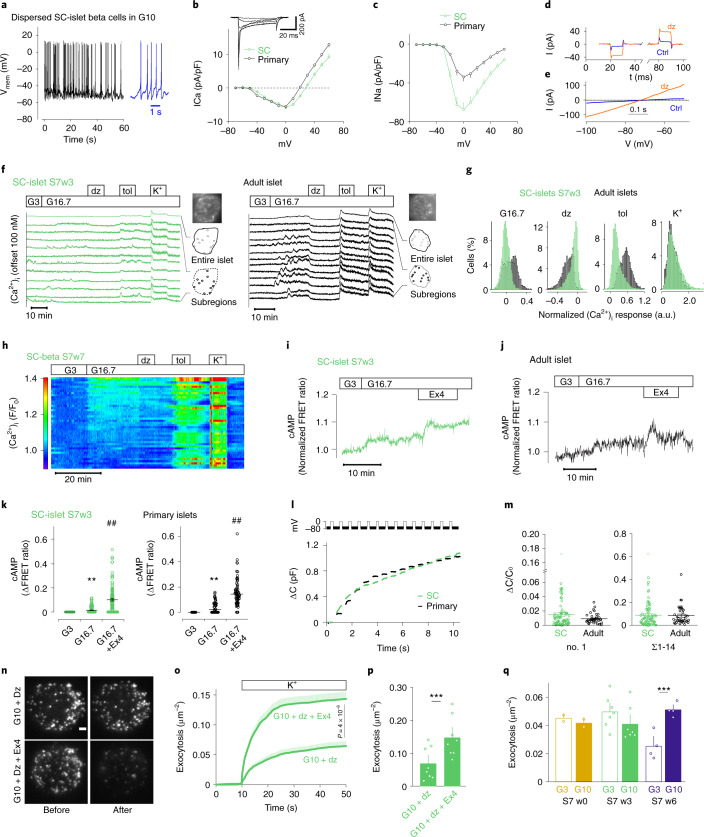
Fig. 2. Voltage-dependent ion currents, [Ca2+]i oscillations, [cAMP]m signaling and exocytosis in SC-derived and primary islet cells.
a, Example membrane potential recording in beta cells of dispersed SC-islets; 10 mM glucose. b–c, Current (I)–voltage (V) relationship in beta cells of dispersed SC-islets (n = 80 cells, eight preparations) or primary islets (n = 39 cells, four donors). Inset shows family of voltage-clamp currents in SC-beta cells (−40 to +10 mV). Average Ca2+ currents (b) and peak Na+ currents (c) (P = 0.002, two-tailed t-test) normalized to cell capacitance (pF). For SC-beta cells, half-maximal current activation was reached at −29 ± 0.9 mV (n = 64) for Ca2+ and at −22.5 ± 0.4 mV (n = 75) for Na+. d–e, Current responses to step-depolarizations (d, ±10 mV around −70 mV, black) or voltage ramps (e, −100 to −50 mV at 100 mV s–1) in controls (Ctrl) or in presence of diazoxide (200 µM) in S7w3 SC-beta cells. f, [Ca2+]i recordings from SC-islets and primary islets exposed to 3 mM (G3) and 16.7 mM glucose (G16.7), 250 µM diazoxide (dz), 1 mM tolbutamide (tol) and 30 mM K+. The uppermost trace shows a quantification from an entire islet and the traces below are representative examples from cell-sized regions of interest. g, Histograms showing the changes of [Ca2+]i in response to various treatments normalized to the levels at G3 in cells from SC-islets (n = 5,254) and primary islets (n = 3,550). h, [Ca2+]i recording specifically from insulin-expressing SC-beta cells using RIP2-R-GECO1. Relative fluorescence changes as a function of time with each line representing one cell. i–j, Representative [cAMP]m recordings from cells in intact SC- (i) and primary (j) islets stimulated with G16.7 and 10 nM exendin-4 (Ex4). k, The effects of G16.7 and Ex4 from experiments as in i and j in SC-islets (n = 119 cells from six independent experiments) and primary islets (81 cells from three preparations) ** P < 0.01 versus G3; ## P < 0.01 versus G16.7, two-tailed Student’s paired t-test. l, Cell capacitance increase (ΔCm) during a train of 14 × 200 ms depolarizations from −70 mV to 0 mV in SC-beta cells and primary beta cells. m, Average change in membrane capacitance, normalized to initial cell capacitance (ΔC/C0), during the first depolarization (no. 1), and total increases during the train (Σ1–14) for SC-beta (n = 80 cells, eight preparations) and primary beta cells (n = 39 cells, four preparations). Dots represent individual cells and lines the mean values. n, Representative TIRF images of SC-beta cells expressing the granule marker NPY-tdmOrange2 in absence (top) or presence of Ex4 (bottom), and before (left) and after (right) stimulation with elevated K+ (in G10 + diazoxide). Scale bar, 2 µm. o, Cumulative timecourse of high K+-evoked exocytosis events normalized to cell area, from experiments as in n, for control (68 cells) and Ex4 (71 cells); two-tailed t-test. Shaded areas indicate s.e.m. p, Total K+ depolarization-induced exocytosis in o. q, Spontaneous exocytosis (normal K+, no diazoxide, normalized to cell area) during a 3-min observation period after >20 min preincubation at G3 or G10. Fusion events were quantified in SC-beta cells at S7w0 (13 cells at G3 and 12 at G10) and at S7w6 (40 cells at G3 and 41 at G10) and normalized to the cell area. In p and q, dots represent averages for individual SC-islet batches. All data presented as means ± s.e.m. unless otherwise indicated.

