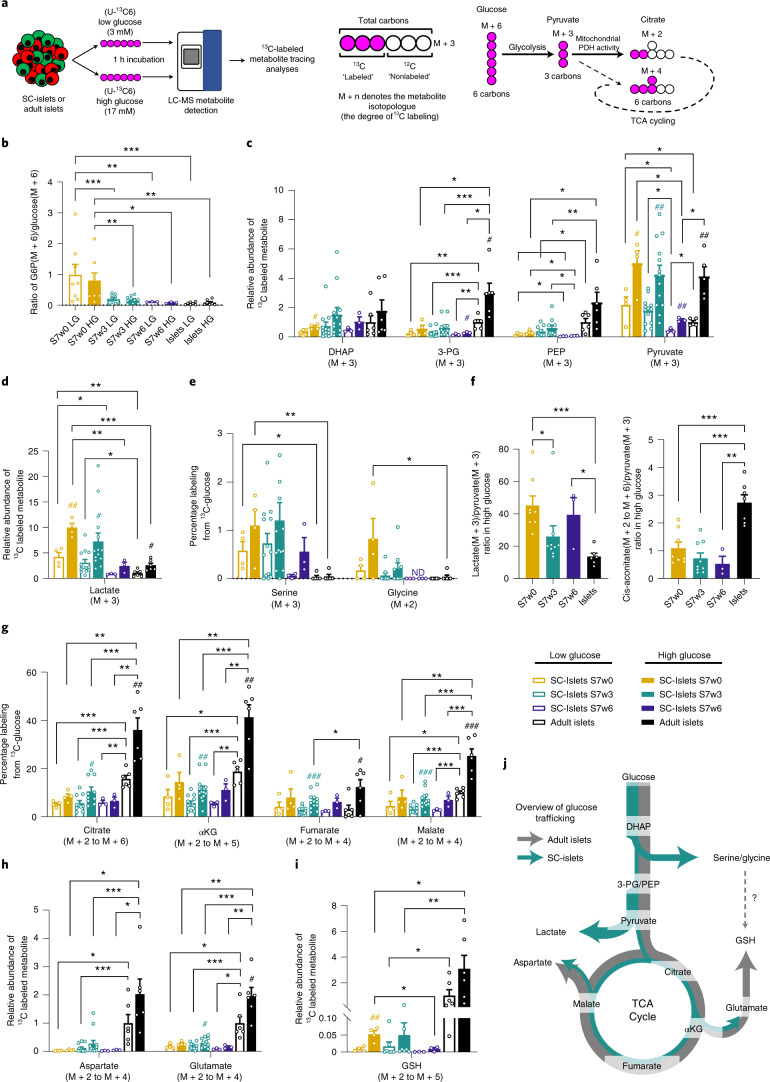
Fig. 4. Metabolic tracing analysis of maturing SC-islets.
a, Left, Overview of experimental setup. SC-islets or adult islets were exposed to low (3 mM) or high (17 mM) concentrations of uniformly labeled [U-13C6] glucose for 1 h before metabolite extraction and liquid-chromatography mass spectrometry (LC-MS) detection. Right, An example of isotopologue nomenclature and glucose-derived labeling of downstream metabolites. b, The ratio of M+6 G6P to M+6 labeled glucose under low and high glucose concentrations in adult islets and SC-islets over 6 weeks of maturation. c, The relative abundances of fully labeled glycolytic intermediates in SC-islets and adult islets following low and high labeled glucose treatment. d, The M+3 lactate content of adult islets and SC-islets detected over the timecourse of maturation, following low and high labeled glucose treatment. e, The percentage of total serine and glycine labeled from 13C-glucose following low and high glucose treatment of SC- and adult islets. f, Ratiometric analysis of labeled lactate to labeled pyruvate, and labeled citrate to labeled pyruvate under high glucose treatment in SC-islets and adult islets. g, The combined percentage of labeled TCA metabolites (M+2 to fully labeled M+n) from SC- and adult islets after low and high labeled glucose treatment. h, The combined abundance of aspartate (M+2 to M+4) and glutamate (M+2 to M+5) isotopologues in SC-islets (w0–w6) under low and high glucose concentrations, relative to adult islets. i, The combined relative abundance of M+2 to M+5 GSH isotopologues under low and high labeled glucose concentrations in adult islets and SC-islets. j, Schematic overview of active glucose metabolic pathways in SC-islets and adult islets. Arrow thickness denotes the extent of glucose-derived carbons entering the pathway. Error bars ± s.e.m. with statistical significance determined by two-tailed t-tests. Hash symbols indicate internal significance from low to high glucose labeling, asterisks denote significance between SC-islet timepoints or adult islet samples at each glucose concentration. #,*P < 0.05, ##,**P < 0.01, ###,***P < 0.001. SC-islets S7w0 (n = 4), S7w3 (n = 12–13), S7w6 (n = 3), adult islets (n = 6).

