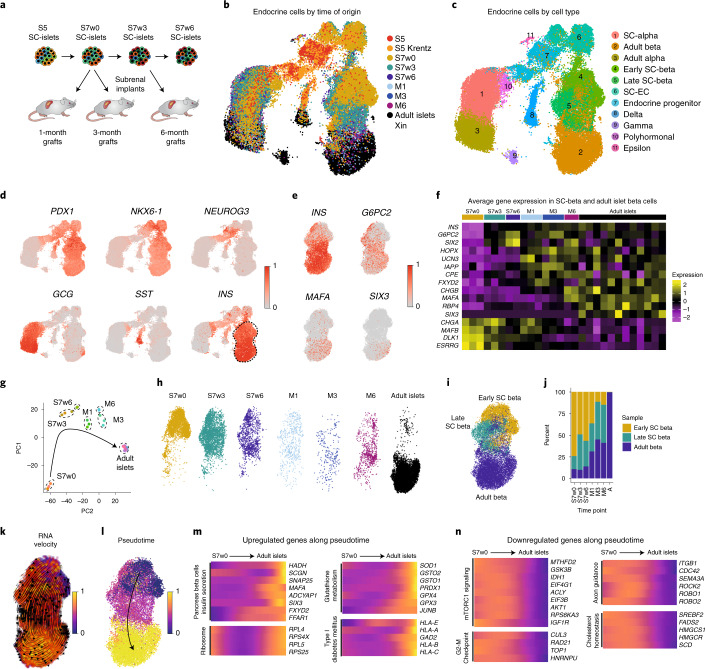
Fig. 5. Single-cell transcriptomic profiling of stem cell derived islet cells.
a, Experimental outline for scRNAseq transcriptomic profiling of SC-islets at the end of in vitro culture stages 5 (S5) and 6 (S7w0) and at week 3 (S7w3) and week 6 of S7 culture (S7w6), together with grafts retrieved after 1 (M1), 3 (M3) and 6 months (M6) postimplantation. b, UMAP-base embedding projection of an integrated dataset of 46,261 SC-derived endocrine cells and adult human islet cells48,49, colored by time and sample of origin. c, Clustering of the dataset in b cells into different cell types. d, Relative expression of marker genes for pancreatic progenitor cells (PDX1, NKX6-1, NEUROG3) and alpha- (GCG), delta- (SST) and beta- (INS) cells. Dashed line indicates the beta cell cluster selected for further study. e, UMAP projection of the beta cell cluster indicating the relative expression of insulin (INS) and mature beta cell markers G6PC2, MAFA and SIX3. f, Average gene expression of beta cell maturation markers in SC-beta cells and adult primary beta cells. The average expression of the beta cell populations (Fig. 1e) coming from each independent sample with different time of origin (S5 to Adult islets) is represented. g, PCA of the beta cell populations from each independent sample. (S7w0, n = 3; S7w3, n = 3; S7w6, n = 2; M1, n = 3; M3, n = 3; M6, n = 2; Adult, n = 12). h, Heterogeneous distribution of the beta cells from different time of origin in the beta cell cluster (Fig. 1e). i, Clustering of beta cells according to their transcriptional similarity into early, late and adult beta cluster. j, Fractional contribution to each early, late and adult beta clusters of beta cells from different times of origin. k, UMAP projection of the beta cell cluster with RNA velocity vectors overlaid. Cells are annotated by latent-time dynamics. Earlier latent timepoints, the origin of the trajectory, are indicated in blue, and later timepoints in yellow on the latent-time color scale. l, Pseudotemporal ordering of cells in the beta cell cluster. Earlier pseudotemporal points, the origin of the trajectory, are indicated in blue, and later pseudotemporal points in yellow on the pseudotime color scale. m,n, Relative expression levels of example genes that are upregulated (m) or downregulated (n) along the pseudotime trajectory inferred in l.

