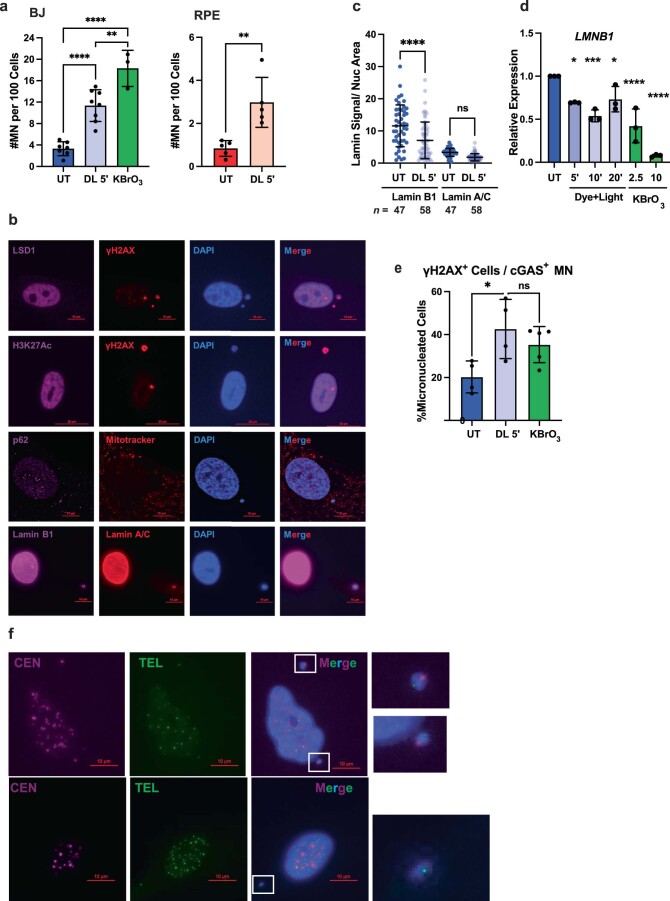
Extended Data Fig. 3. Characterization of telomeric 8oxoG induced cytoplasmic DNA.
(a) Quantification of the number of MN per 100 nuclei for BJ and RPE FAP-TRF1 cell 4 days after 5 min dye + light, or for BJ after one hour 2.5 mM KBrO3. At least 300 cells scored per experiment. (b) Representative images of RPE FAP-TRF1 cells stained for the indicated markers 4 days after 5 min dye + light treatment (related to Fig. 2b). Scale bar = 10 μm for rows 1, 3-4, and 20 μm for row 2. (c) Quantification of Lamin B1 and Lamin A/C signal intensity normalized to nuclear area from Panel (b). Error bars represent the mean ± s.d. from the indicated n number of nuclei analyzed. Statistical analysis by two-way ANOVA (ns = not significant, ****p < 0.0001). (d) Quantification of LMNB1 mRNA from BJ FAP-TRF1 cells 4 days after 5, 10 or 20 min dye + light, or one hour 2.5 or 10 mM KBrO3, relative to untreated. (e) Quantification of the percent of BJ FAP-TRF1 cells with micronuclei that show overall nuclear γH2AX staining and have a cGAS positive micronucleus 4 days after 5 min dye + light or one hour 2.5 mM KBrO3 treatment. For panels a and d-e, error bars represent the mean ± s.d. from the number of independent experiments indicated by the black circles in the bar graphs. Statistical significance was determined by two-tailed t-test (panel a RPE) or one-way ANOVA (panel a BJ, and d-e). (ns = not significant, *p < 0.05, **p < 0.01, ***p < 0.001, ****p < 0.0001). (f) Representative images of RPE FAP-TRF1 cells 4 days after 5 min dye + light treatment and stained with centromeric and telomeric PNAs by FISH. White boxes zoom in on MN. Scale bar = 10 μm.

