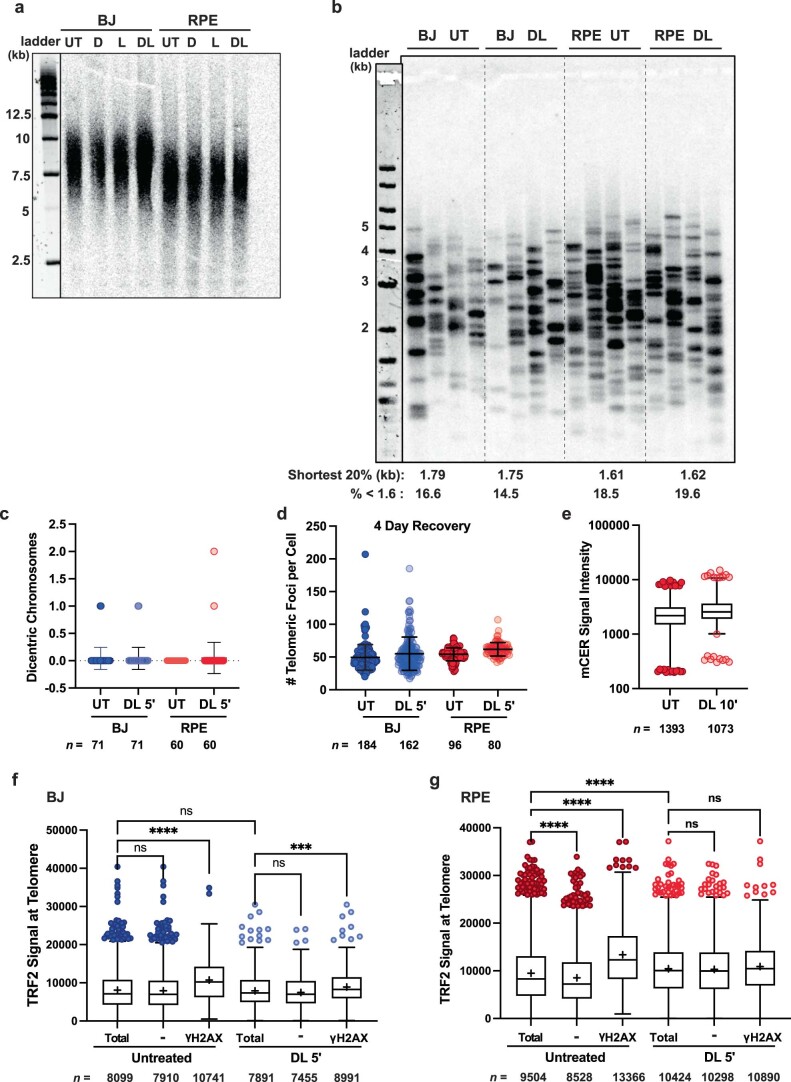
Extended Data Fig. 8. Acute telomere 8oxoG damage does not cause telomere shortening or shelterin loss.
(a) Southern blot for telomere restriction fragment length analysis obtained from BJ and RPE FAP-TRF1 after 4 days recovery from no treatment (UT) or 5 min dye alone (D), light alone (L), or dye + light (DL) together. (b) TeSLA obtained from BJ and RPE FAP-TRF1 after 4 days recovery from no treatment (UT) or 5 min dye + light. Each lane is an independent PCR from the same pool of genomic DNA. Averages of telomere length for the shortest 20th percentile and the percent of telomeres shorter than 1.6 kb from two independent experiments are shown below. (c) Quantification of dicentric chromosomes defined as two centromeric foci for p53ko BJ (blue) and RPE (red) FAP-TRF1 cells 24 h after 5 min dye + light. (d) Quantification of telomere foci measured by telo-FISH for BJ (blue) and RPE (red) FAP-TRF1 cells 4 days after 5 min dye + light. For panel c-d, error bars represent the mean ± s.d. from the indicated n number of metaphases (c) or foci (d) analyzed. Statistical analysis by one-way ANOVA, all p-values were non-significant. (e) Quantification of mCER signal intensity per telomere foci from FAP-mCER-TRF1 in wild-type RPE FAP-TRF1 cells after no treatment (UT) or 10 min dye + light (DL 10’). Box plot shows the median and 25th to 75th interquartile range, and whiskers showing 1st to 99th percentiles. Statistical analysis by one-way ANOVA, all p-values were non-significant. (f,g) TRF2 colocalization with telomeres analyzed by IF and telo-FISH immediately after 5 min dye + light. DDR + telomeres were identified by γH2AX co-localization. TRF2 signal intensity was quantified per telomere foci either – or + for γH2AX in BJ (f) and RPE (g) FAP-TRF1 cells. Tukey box plot shows medians (bar), means (+), 25th to 75th interquartile range (IQR), and whiskers showing 25th or 7th percentile ± 1.5x the IQR. Statistical analysis was by Kruskal-Wallis (ns=non-significant, ***p < 0.001, ****p < 0.0001).

