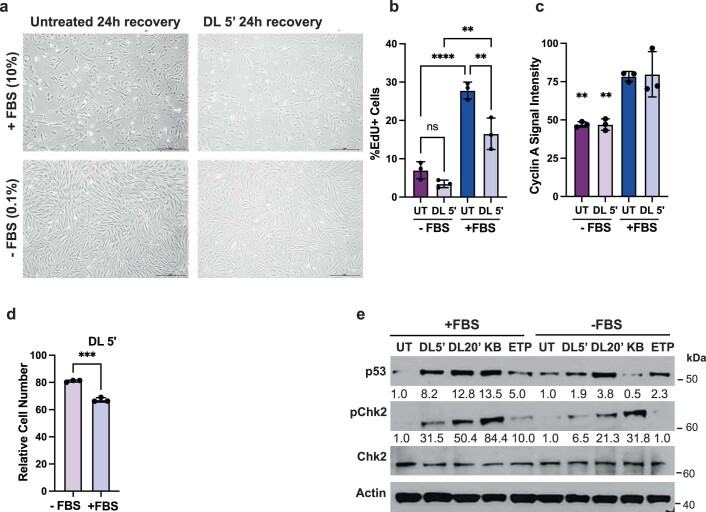
Extended Data Fig. 10. Suppression of replication and p53 activation in cells cultured in FBS deficient media.
(a) Representative brightfield images of BJ FAP-TRF1 cells grown with the indicated FBS concentration and after the indicated treatment. Scale bar = 100 μm. (b,c) Quantification of EdU-positive cells (b) and Cyclin A nuclear signal (c) in BJ FAP-TRF1 cells 24 hours after the indicated treatments and recovery in 10% FBS ( + ) or 0.1% FBS (-), as in main Fig. 6d upper panel. Error bars represent the mean ± s.d. from number of independent experiments indicated by the black circles. Statistical analysis by one-way ANOVA (**p < 0.01, ****p < 0.0001). In panel (c) significance is shown for -FBS cells relative to +FBS cells. (d) Cells were treated as described in main Fig. 6d lower panel, and counted 4 days after changing all cell culture media to 10% FBS media. Data are cell counts relative to the respective untreated control. Error bars represent the mean ± s.d. from number of independent experiments indicated by the black circles. Statistical analysis by two-tailed t-test (***p < 0.001). (e) Cells were cultured in 10% FBS ( + ) or 0.1% FBS (-) as in main Fig. 6d, upper panel, but harvested for immunoblot 3 h after treatment. KBrO3 (KB, 2.5 mM) and etoposide (50 μM) were 1 h treatments with 3 h recovery. Numbers below p53 and pChk2 blots represent normalized protein expression.

