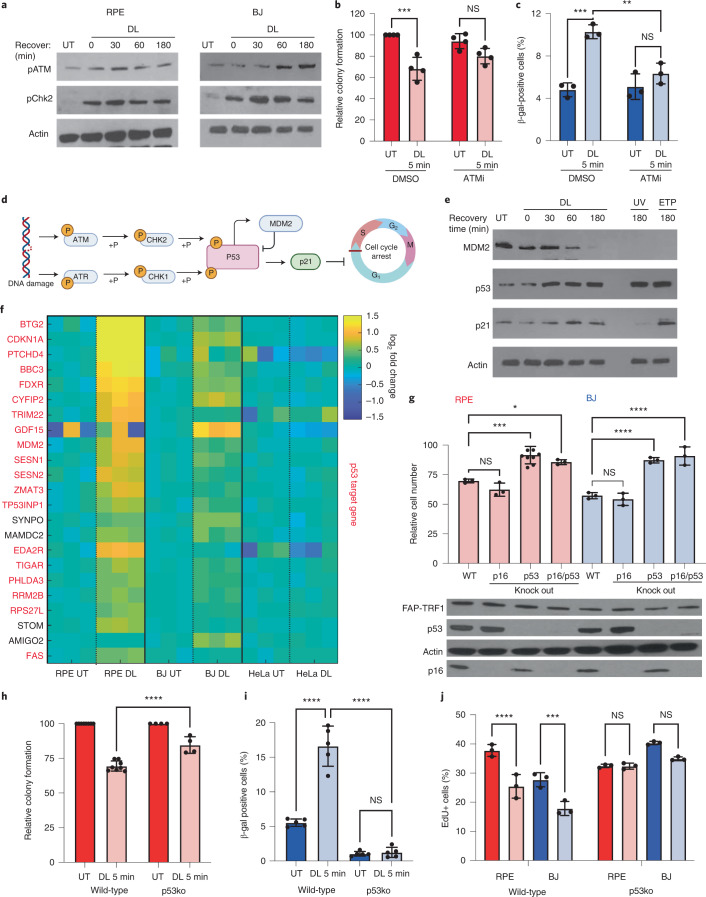
Fig. 3. p53 DNA damage signaling is required for 8oxoG-induced senescence.
a, Immunoblots of phosphorylated ATM (pATM) and phosphorylated Chk2 (pChk2) at the indicated recovery time following 5 min DL. b, RPE FAP-TRF1 colony formation after 7 days recovery from DL. Cells were cultured with ATMi KU60019 or DMSO only during recovery. Numbers are relative to untreated DMSO control. c, Percentage of β-gal positive BJ FAP-TRF1 cells obtained 4 days after DL. Cells were cultured with ATMi KU60019 or DMSO only during recovery. d, Schematic of canonical DNA damage-induced p53 activation by ATM and ATR kinases. Created with Biorender.com. e, Immunoblot of untreated BJ FAP-TRF1 cells, or treated with DL and recovered for the indicated times. UV = 20 J m–2 UVC. ETP = 1 h 50 μM ETP. f, Heat map of mRNASeq results from FAP-TRF1-expressing RPE, BJ and HeLa cells 24 h after no treatment (NT) or 5 min DL. Shown are the top altered genes and p53 target genes are in red. Each column is an independent replicate. g, Cell counts of wild-type, p16ko, p53ko or p16+p53 double ko of BJ (blue) or RPE (red) FAP-TRF1 cells 4 days after recovery from 5 min DL relative to respective untreated cells. Immunoblot below shows FAP-TRF1, p53, p16 expression. h, RPE FAP-TRF1 colony formation after 7 days recovery from DL. i, Percentage of β-gal positive BJ FAP-TRF1 cells obtained 4 days after treatment. j, Percent EdU-positive cells observed 24 h after 5 min DL (light red or light blue). Over 200 cells were scored per condition in each experiment. For b,c, and g–j, error bars represent the mean ± s.d. from the number of independent experiments indicated by the black circles. Statistical significance in b,c and h–j determined by two-way ANOVA, and for g by one-way ANOVA (ns, not significant; *P < 0.05; **P < 0.01; ***P < 0.001; ****P < 0.0001).

