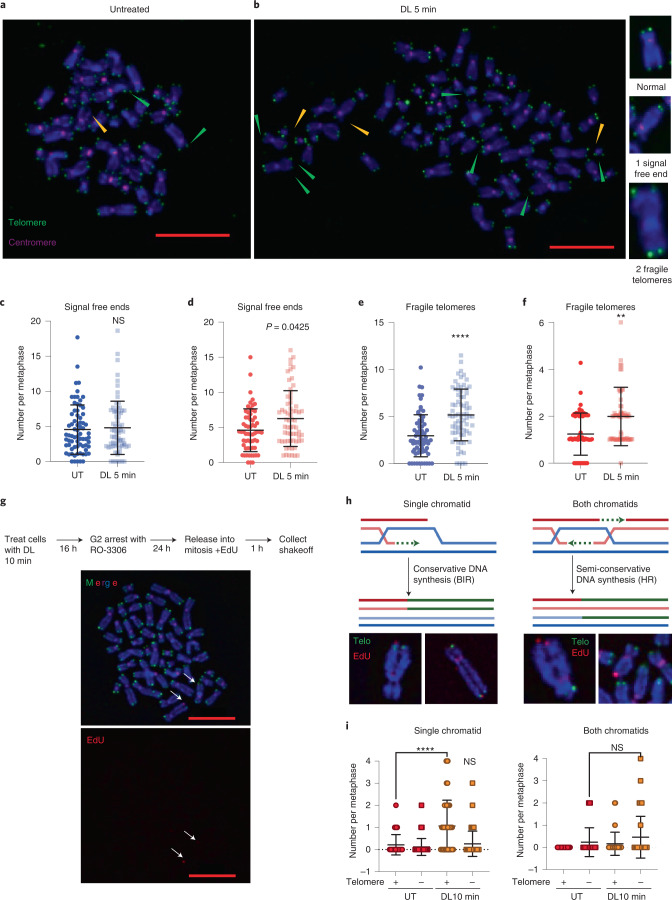
Fig. 5. 8oxoG directly disrupts telomere replication.
a,b, Representative images of telo-FISH staining of metaphase chromosomes from BJ FAP-TRF1 p53ko cells 24 h after no treatment (a) or 5 min DL b, Images were scored for telomeric signal-free ends (yellow arrowheads) and fragile telomeres (green arrowheads). Green foci are telomeres and pink foci are CENPB centromeres. Scale bars, 10 μm. c,d, The number of telomeric signal-free chromatid ends per metaphase in BJ (c) and RPE (d) FAP-TRF1 cells. e,f, The number fragile telomeres per metaphase in BJ (e) and RPE (f) FAP-TRF1 cells. For c–f, error bars represent mean ± s.d. from n = 71 (UT) and 72 (DL 5 min) for BJ and n = 61 (UT) and 63 (DL 5 min) for RPE, metaphases analyzed from three independent experiments, normalized to the chromosome number. Statistical analysis by two-tailed Mann–Whitney (ns, not significant; **P < 0.01; ****P < 0.0001). g, Schematic of MiDAS experiment in p53ko RPE FAP-TRF1 cells (Top) and representative metaphase spread with Telo PNA (green) and EdU staining (red). Arrows point to telomeric MiDAS. Scale bars, 10 μm. h, Schematics for EdU events at a single chromatid (BIR) and both chromatids (HR). Representative images from DL-treated RPE FAP-TRF1 cells are shown below. i, Telomere MiDAS events at a single chromatid (left) or both chromatids (right). Events are scored for chromatid ends staining positive (Telo+) or negative (Telo–) for telomeric PNA. Error bars represent the mean ± s.d. from 51 (UT) and 61 (DL 10 min) metaphases from two independent experiments. Statistical analysis by one-way ANOVA (ns, not significant; ****P < 0.0001).

