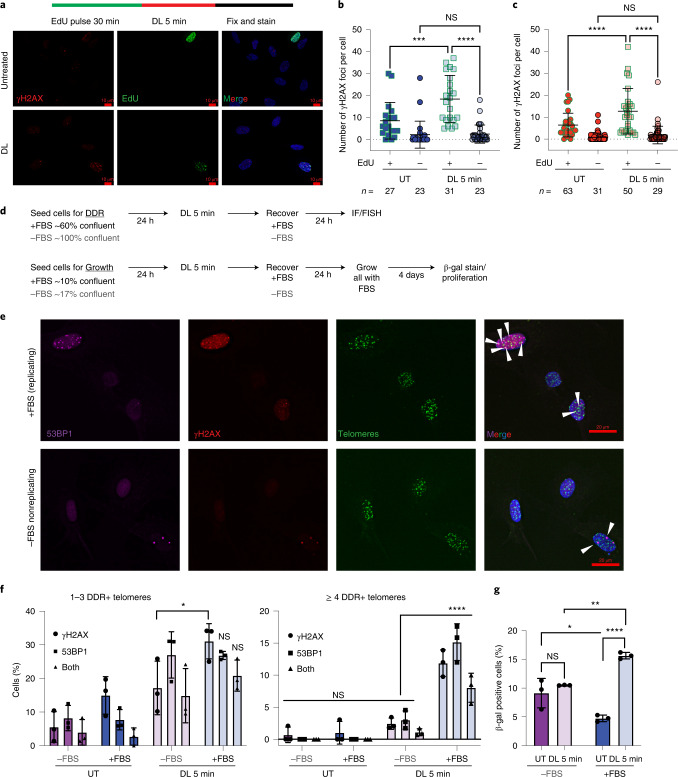
Fig. 6. Replicating cells are more sensitive to telomeric 8oxoG.
a, Schematic shows experiment for EdU labeling of S-phase cells. Representative image of γH2AX (red) and EdU (green) staining of BJ FAP-TRF1 cells after 0 h recovery from 5 min DL. Scale bar, 10 μm. b,c, Number of γH2AX foci per EdU– and EdU+ cells for BJ (b) and RPE (c) FAP-TRF1 cells. Error bars represent the mean ± s.d. from the indicated n number of nuclei analyzed from two independent experiments. Statistical analysis by one-way ANOVA (ns, not significant; ***P < 0.001; ****P < 0.0001). d, Schematic of experiments for telomere DDR detection (top, e,f) and senescence assays (β-gal and proliferation) (bottom, g and Extended Data Fig. 10d) in replicating (cells grown with 10% FBS (+FBS)) and nonreplicating (cells grown with 0.1% FBS (–FBS)) BJ FAP-TRF1 cells. e, Representative IF/FISH images for the telomere DDR experiment. Scale bar, 20 μm. f, Percentage of cells with one to three or four or more DDR+ (γH2AX, 53BP1, or both) telomeres from e. Over 70 nuclei were analyzed per condition per experiment. g, Cells were seeded in medium with 0.1% (–) or 10% (+) FBS, treated the next day with 5 min DL and then recovered 24 h with 0.1 (–) or 10% (+) FBS. All cells were cultured in 10% FBS medium another 4 days before staining for β-gal activity. At least 300 cells were analyzed per condition per experiment. For f,g, error bars represent the mean ± s.d. from the number of independent experiments indicated by the black circles. Statistical significance determined by two-way ANOVA (ns, not significant; *P < 0.05; **P < 0.01; ****P < 0.0001).

