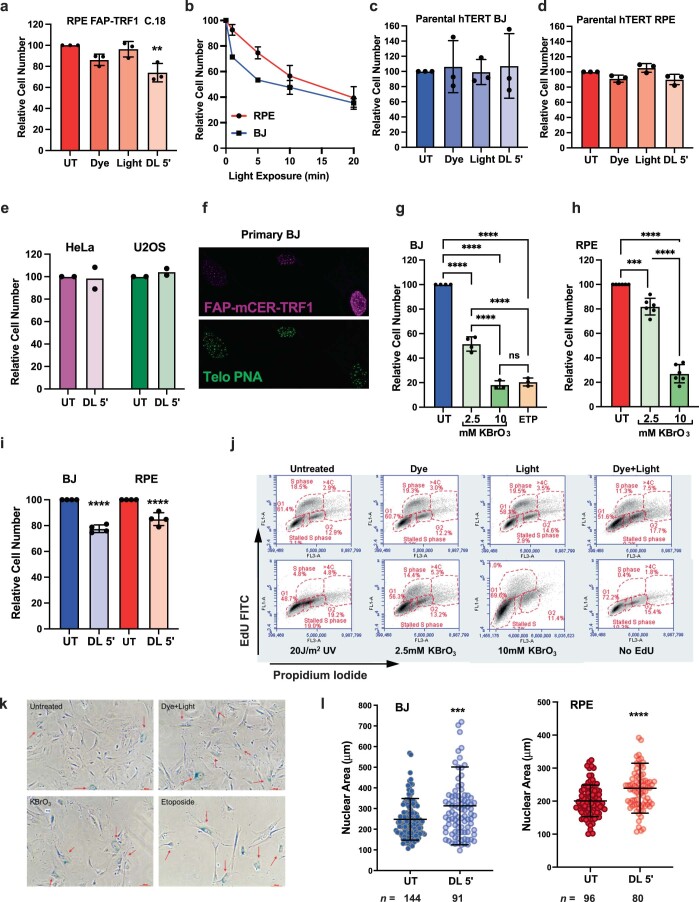
Extended Data Fig. 2. Characterization of damage-induced growth reduction and senescent phenotypes.
(a) Cell counts of an additional RPE FAP-TRF1 clone (#18) obtained 4 days after recovery from indicated treatments. (b) Cell counts of RPE FAP-TRF1 (red) and BJ FAP-TRF1 (blue) cells 4 days after recovery from dye + light treatments relative to untreated. Error bars represent the means ± s.d. from three independent experiments. (c-d) Cell counts of parental BJ-hTERT (c) or RPE-hTERT (d) cells obtained 4 days after recovery from indicated treatments. (e) Cell counts of FAP-TRF1 expressing HeLa and U2OS clones obtained 4 days after recovery from 5 min dye + light treatment relative to untreated. Black circles indicate the number of independent experiments. (f) Representative image of FAP-mCER-TRF1 protein colocalization with telomeres in bulk population primary BJ cells visualized by mCER IF (pink) with telo-FISH (green). (g-h) Cell counts of BJ (g) or RPE (h) FAP-TRF1 cells 4 days after recovery from one hour treatments with 2.5 or 10 mM KBrO3, and for BJ FAP-TRF1 with 50 μM etoposide (ETP). (i) Cell counts of BJ or RPE FAP-TRF1 cells obtained 24 hours after recovery from 5 min dye + light treatment relative to untreated. For panels a, c-d and g-i, error bars represent the mean ± s.d. from the number of independent experiments indicated by the black circles in the bar graphs. Statistical significance determined by one-way ANOVA (ns = not significant, **p < 0.01, ***p < 0.001, ****p < 0.0001). (j) Flow cytometry plots of RPE FAP-TRF1 cells showing gating based on EdU and propidium iodine staining for various cell cycle phases 24 h after no treatment or exposure to dye, light, 5’ dye + light, 20 J/m2 UVC, or one hour treatment with 2.5 or 10 mM KBrO3. (k) Representative images of β-galactosidase positive BJ FAP-TRF1 cells obtained 4 days after recovery from indicated treatments (From Fig. 1h-i). Scale bar = 100 μm. (l) Size of nuclear area (μm2) of BJ (blue) or RPE (red) FAP-TRF1 cells obtained 4 days after recovery from no treatment or 5 min dye + light. Error bars represent the mean ± s.d. from the indicated n number of nuclei analyzed. Statistical analysis by two-tailed t-test (***p < 0.001, ****p < 0.0001).

