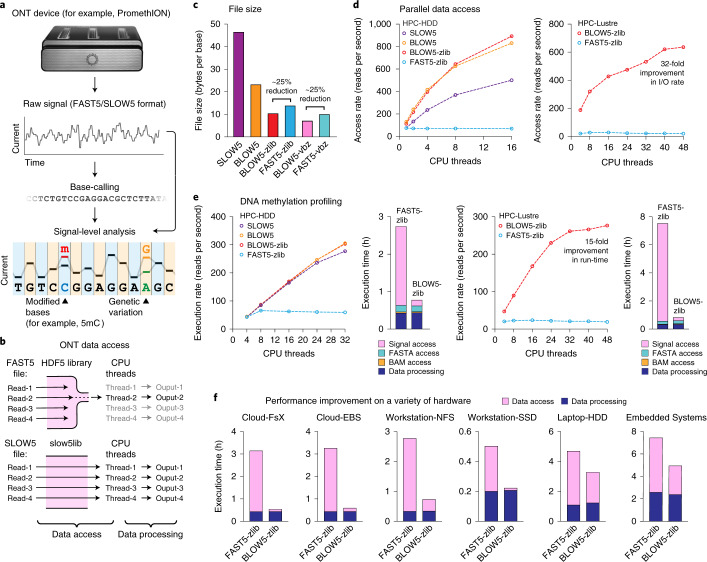
Fig. 1. SLOW5 format enables efficient parallel analysis of nanopore signal data.
a, Schematic diagram illustrating the typical life cycle of nanopore data. Raw current signal data are generated on an ONT sequencing device and written in FAST5 format. Raw data are base-called into sequence reads (FASTQ/FASTA format). Downstream analysis involving both base-called reads and raw signal data is used to identify genetic variants, epigenetic modifications (for example, 5mC) and other features. b, Schematic diagram illustrating the bottleneck in ONT signal data analysis. FAST5 file reading requires the HDF5 software library, which serializes file access requests by multiple CPU threads, preventing efficient parallel analysis. SLOW5 files are not dependent on the HDF5 library and are amenable to efficient parallel analysis. A more detailed mechanistic diagram is provided in Extended Data Fig. 1e. c, Bar chart shows the relative file sizes (bytes per base) of a typical human genome sequencing dataset in ASCII SLOW5 (purple), binary BLOW5 format with no compression (orange), zlib compression (red) and vbz compression (pink), compared to FAST5 format with zlib compression (blue) and vbz compression (teal). d, Dot plots show the rate of file access (reads per second) for the above file types, as a function of CPU threads used on two HPC systems: HPC-HDD (left) or HPC-Lustre (right). e, Dot plots show the rate of execution (reads per second) for DNA methylation calling for the same file types on HPC-HDD (left) and HPC-Lustre (right). For the instance of maximum CPU threads, bar charts show the time consumed by individual workflow components: FAST5/SLOW5 data access (pink), FASTA data access (teal), BAM data access (orange) and data processing (navy). f, Bar charts show the time consumed by data access (pink) and data processing (navy) during DNA methylation calling on a range of different computer systems. Full specifications are provided in Supplementary Table 2.

