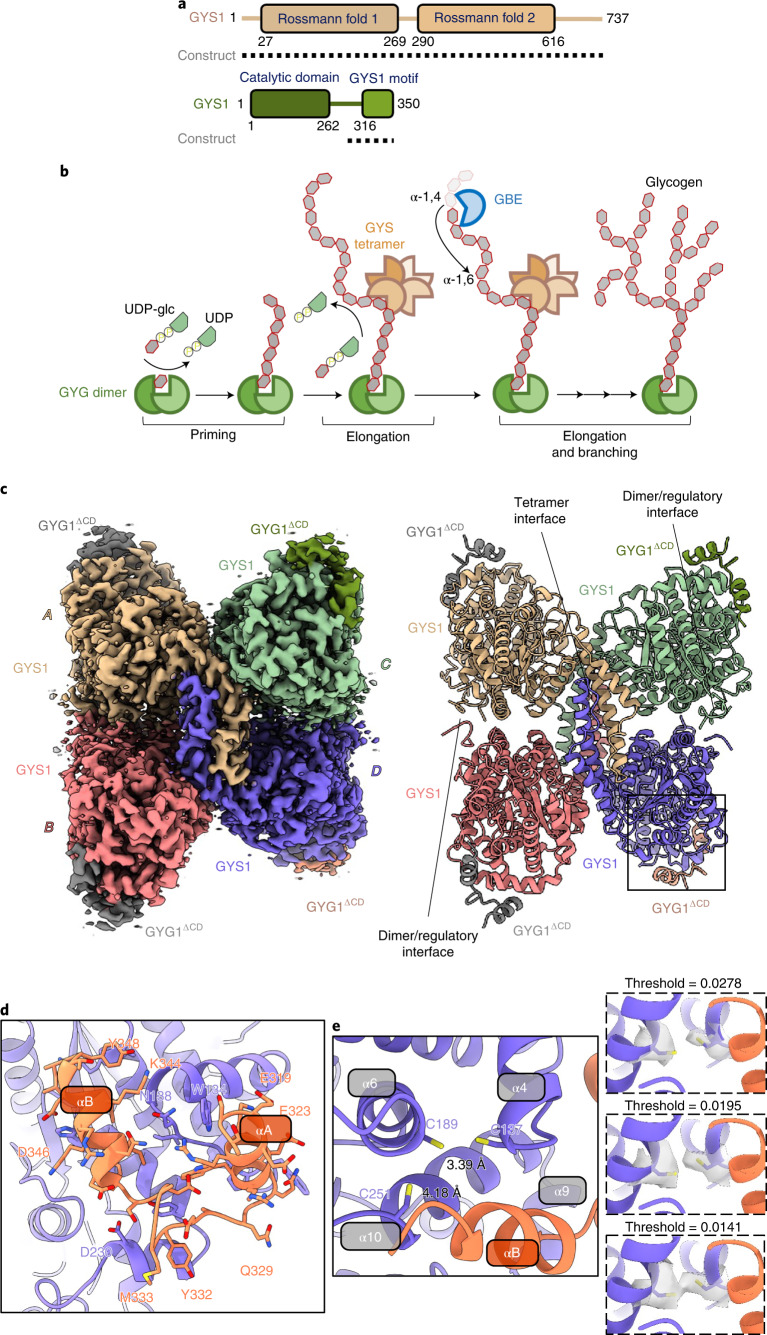
Fig. 1. Structure of the phosphorylated inhibited (T state) GYS1–GYG1ΔCD complex.
a, Domain diagrams of human GYS1 and GYG1. Dotted lines represent the construct boundaries of the GYS1–GYG1ΔCD complex used in all cryo-EM experiments. b, Schematic of the enzyme-catalyzed reactions of GYG1, GYS1 and GBE. Glycogen synthesis is a multistep process consisting of a priming step by GYG followed by an elongation step carried out by GYS and then a branching step by GBE. c, Cryo-EM map and model of the tetrameric GYS1–GYG1ΔCD complex at 3.0 Å resolution. Individual GYS1 and GYG1 subunits are coloured separately. d, Enlarged view of the GYG1 region interacting with GYS1. GYS1 is coloured purple and GYG1 is coloured coral. e, Residues Cys137, Cys189 and Cys251 form a cysteine-rich pocket on GYS1 at the interface with GYG1. Inset shows different contour levels for the cryo-EM density of Cys137 and Cys189.

