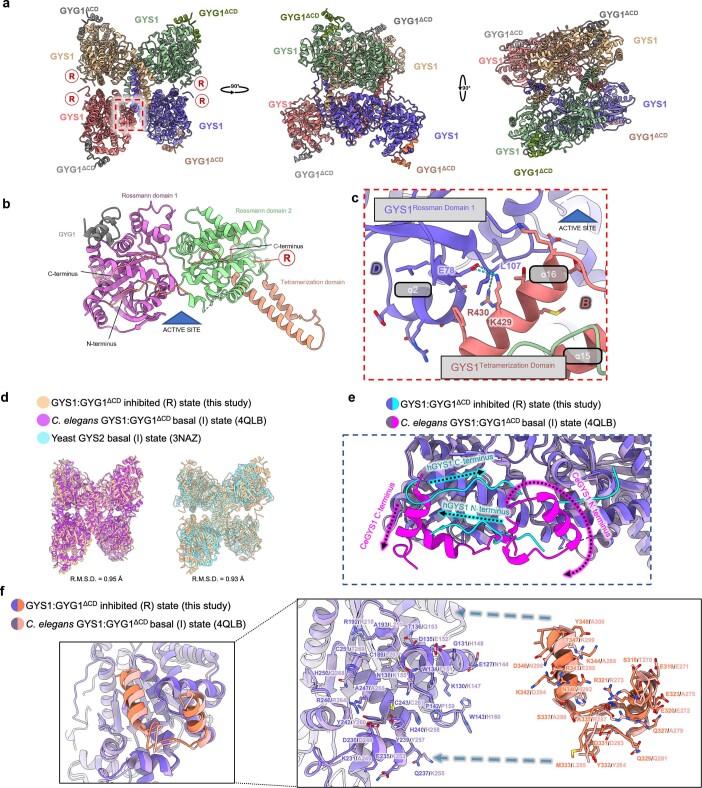
Extended Data Fig. 3. Structure of the GYS1:GYG1ΔCD inhibited state and comparison with the C. elegans gsy-1 and yeast Gsy2p basal/intermediate state structures.
a, Model of the GYS1:GYG1ΔCD inhibited state in three orthogonal views. R represents the location of the regulatory helix. b, Structural model of a GYS1:GYG1ΔCD subunit showing the three domains of GYS1 as well as the GYG1 C-terminus. c, Close up of the inter-subunit interactions close to the active site cleft. d, Structural alignment of the inhibited/T state of the human GYS1:GYG1ΔCD complex with the basal/I states of yeast Gsy2p and C. elegans gsy-1:gyg-1ΔCD complex. e, A zoom in view of the GYG1 interacting region of GYS1 of human and C. elegans. f, A structural alignment of the inhibited/T state of human GYS1 against the basal/I state of C. elegans gsy-1 highlighting the different trajectories of the N- and C- termini.

