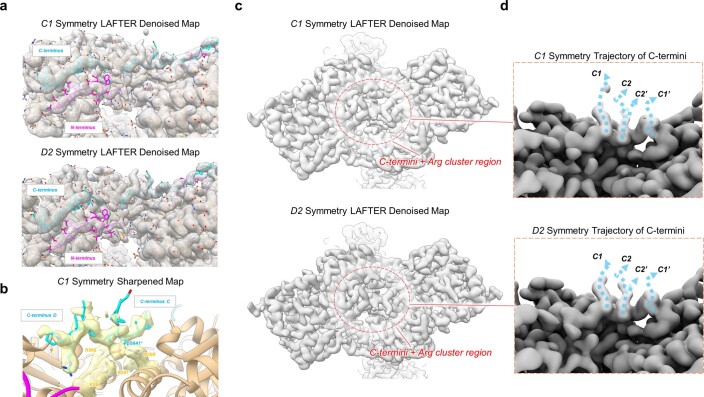
Extended Data Fig. 4. Modelling of the N- and C- termini of the inhibited/T state of the GYS1:GYG1 complex.
a, Fitting of the N- and C- termini model into the C1 and D2 symmetry LAFTER denoised maps. b, Fitting of the phosphorylated C- termini model into the sharpened C1 symmetry map. c, Views of the regulatory dimeric interface of the C1 and D2 symmetry LAFTER maps. The phosphorylated C-termini region density is symmetric in both maps. d, Predicted directions of the phosphorylated C-termini in C1 and D2 symmetry LAFTER denoised maps. The C-termini are predicted to continue away from the dimeric regulatory interface from two adjacent but different locations.

