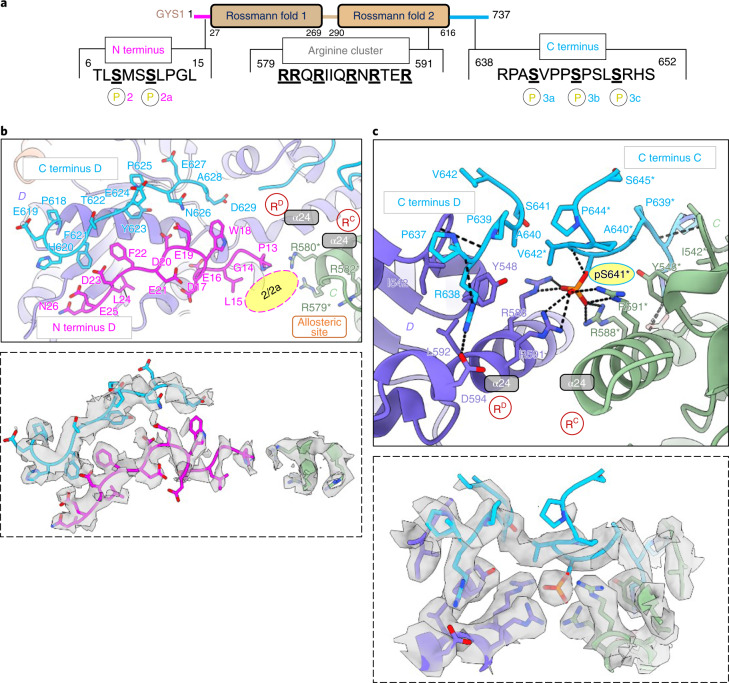
Fig. 2. N and C termini of phosphorylated GYS1–GYG1ΔCD complex in the inhibited (T) state.
a, Key sites of phosphorylation and arginine cluster of a GYS1 subunit. b, Model of the N and C termini of one subunit (D shown) pointing towards the allosteric sites and arginine clusters (RC and RD) at the dimeric C–D interface. Inset shows the EM density of both termini, along with arginine residues from the neighbouring subunit that would interact with phosphorylation sites 2 and 2a. c, Model of C-terminal residues 637–645 from two neighbouring subunits (C and D shown) interacting with their arginine clusters at the dimeric C–D interface. Inset shows EM density of both C termini along with arginine clusters from both subunits interacting with a single site 3a phosphorylation (pS641). Asterisks indicate residues from the neighbouring subunit. Arginine clusters containing α24 helices are labelled. Putative locations for phosphorylation sites 2 and 2a are indicated by pink ovals.

