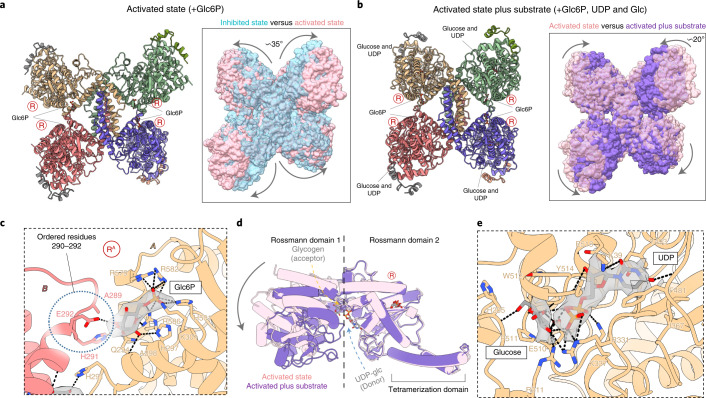
Fig. 3. Activated structures of the phosphorylated R-state GYS1–GYG1ΔCD complex with and without substrate.
a, Structure of the Glc6P-bound activated (R) state determined from a 3.7 Å map. Inset shows the global conformational changes resulting from Glc6P activation in comparison with the inhibited (T) state. b, Structure of the R state bound to Glc6P, UDP and glucose determined from a 3.0 Å map. Inset shows the global conformational changes resulting from substrate binding in the activated state. Arginine clusters-containing regulatory α24 helices are labelled ‘R’. c, Cis and trans interactions with the Glc6P activator in the R state determined from the higher-resolution substrate-bound map. Interactions with Glc6P in the lower-resolution map without substrate were the same. Cryo-EM density for Glc6P is shown. d, Conformational changes of Rossmann domain 1 in relation to Rossmann domain 2 due to UDP and glucose binding in the R state. e, Interactions with UDP and glucose in the R state. Cryo-EM densities for both ligands are shown.

