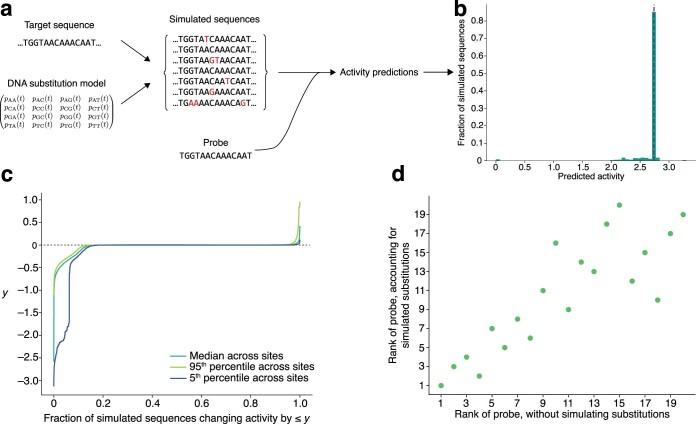
Extended Data Fig. 8. Estimating probe activity under forecasted substitutions.
a, Sketch of proactive scheme to estimate probe performance, after a period of time, by forecasting relatively likely nucleotide substitutions. Starting with a target sequence and a GTR substitution model, we sample from a distribution of substitutions made to the original target sequence. In analyses that follow, we sample after 5 years. Against each simulated sequence, we predict the detection activity of a given probe using our Cas13a predictive model; across the simulated sequences, these predictions provide a distribution of activity under potential substitutions. b, Distribution of predicted detection activity across 10,000 simulated sequences that originate from a target sequence at one site in the SARS-CoV-2 genome. The probe is complementary to the original target sequence, except we randomly introduce a single mismatch. Most simulated sequences do not introduce any substitutions (i.e., they are identical to the original); the peak in the histogram (and vertical dashed line) represents these ones. Other than these simulated sequences, most simulated substitutions degrade the activity of the probe (left of the dashed line). Some enhance its activity (right of the dashed line), for example, by reversing the existing mismatch. c, Inverse CDF of the change in predicted detection activity after simulating substitutions, summarized across 1,000 random sites in the SARS-CoV-2 genome; b shows one such site. At each of these 1,000 sites, we simulate 10,000 target sequences according to our substitution model and construct a distribution of the change in the probe’s predicted detection activity compared to its activity in detecting the original sequence. As in b, at each site the probe is complementary to the original target sequence, except with one random mismatch. Plotted is the median change taken across sites, as well as the 95th and 5th percentiles. The faster the curve rises to 0, the less likely there is to be a drop in activity. That the 5th percentile curve shows a sharp drop for low values (∼<0.1) on the horizontal axis indicates that some sites may experience a pronounced drop in detection activity over time, but that even for these sites it is unlikely (∼10% chance). d, Effect of simulating substitutions on the ordering of ADAPT’s designs. We begin with the top 20 design options output by ADAPT for targeting SARS-CoV-2 genomes and, for this analysis, consider only the probe (Cas13a guide) from each design option. Each point represents one of the 20 probes. We rank the probes according to their mean predicted detection activity across the genomes; this ranking is on the horizontal axis. Then, for each genome, we simulate 10,000 sequences according to our substitution model (at the site where a probe binds) and compute the 5th percentile of the predicted detection activities between the probe and these simulated sequences. We rank the probes accounting for simulated substitutions (vertical axis) according to the mean of this 5th percentile value taken across the genomes. In this analysis, we use only 500 randomly sampled genomes from the set of genomes used to design the 20 probes with ADAPT, in order to reduce runtime.

